Moving Charts: TRX Value Per Coin Analysis | 10% To @tron-fan-club
Hello and welcome to everyone at the Tron fan club. Today we take a look at TRX and its price movements. Very recently the market has been relatively stable and is actually gaining some pace. Trx has been following the mass trend and the result is reflected in the chart. And as usual, we start from a week ago.

Made with Canva.
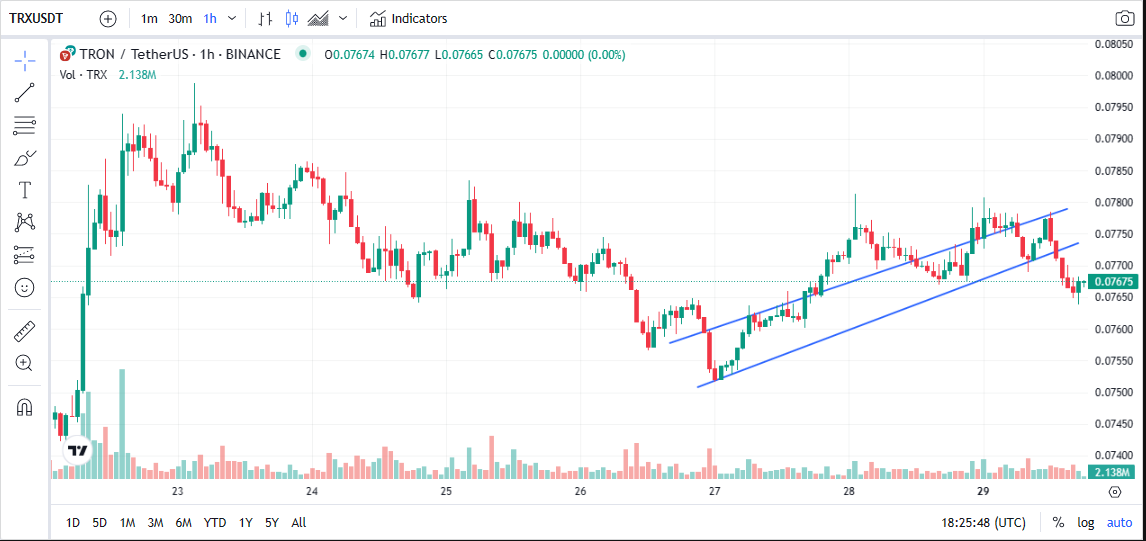
7 days back, TRX was valued at 0.074$ note to remember that this is already on the back of a good uptrend. Because previously TRX was below 0.07$. So after being at 0.074$, TRX shot up riding a pump, and as a result, TRX went up to a respectable height of 0.0799$. it couldn't touch 0.08$. but after that Bitcoin crashed, and coincidentally TRX crashed too. But relatively slowly. From 0.0799$ TRX gradually went down. From the 23rd of May onwards, TRX gradually went down in value all the way till the 26th of May. At that point, TRX was valued at 0.075$. it's a significant fall when you consider the number of tokens people are holding at a time, which is valued at this rate.
What comes next is a reversal. And recovery. Only to some extent, but still understandable. From a measly low where TRX was during that period. From 0.075$, TRX went all the way up to 0.078$, which is just over half of the value recovered. All this happened in one day. On the 28th of May, the prices stayed mostly the same. So no major change on the day apart from partial fluctuation. Since then, today the prices have gone down just a bit. Not much. TRX is currently valued at 0.076$
All Screenshots are taken from Coingecko
The last bit of plummeting doesn't look to be something bad, I'd like to believe it's just a simple low. But it could be bad, who knows. Only one way to find out.
VOTE @bangla.witness as witness

OR

I know a lot from TRX Value Per Coin Analysis.