NEM Price Analysis - A Potential New Bull Trend by Josh Olszewicz

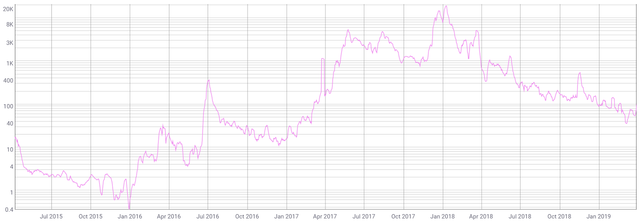
New Economy Movement (XEM), or NEM, is a cryptocurrency with a unique codebase, launched in March 2015. Like the rest of the market, NEM has been hit hard during the crypto winter and is down 97% from its January 2018 all-time high of US$2.11. The current spot price is US$0.07. The market cap is US$643 million, with US$10.5 million traded over the past 24 hours.
The NEM genesis block minted a fixed number of tokens. The total supply is nine billion XEM and no additional tokens will be created. The project went on to raise 66.2 Bitcoin (BTC) and 419,697 Nxt (NXT), or about US$150,000, through a "call for participation." XEM tokens were sold for an average price of 0.05 BTC and 450 NXT. Overall, about 200 individuals participated in the pre-launch public auction. Another 71% of the total coins were released via a stakeholder community distribution.
Initially, the remaining 2.35 billion XEM, or about 26% of all coins, were earmarked for developer funds or adoption initiatives. The current balance is 1.78 billion XEM, or about 20% of the tokens.
In August 2018, the NEM community approved the creation of NEM Ventures, which is funded by the NEM Community Fund. This legal entity is an investment vehicle for traunched funding tied to measurable, clear milestones which promote the NEM ecosystem.
Like the other NEM divisions, NEM Ventures has its own unique governance and budgets and operates in a similar manner to a traditional VC/equity firm. Ventures undertakes the sourcing, screening and funding startups with the potential to enhance and compliment the NEM ecosystem.
NEM also has a foundation to further development and adoption. The Singapore-based NEM Foundation, created in 2016, is a non-profit organization originally set up to introduce, educate, and promote the use of the NEM blockchain technology platform to industry and institutions across the globe.
In late January, it was announced that the foundation only had a month of funding left and "could no longer support its current headcount, partnerships, and projects." Operations were put on hold while the organization was restructured to be less promotional and more product-focused and revenue-driven. The restructuring included electing a new governance council, a process which occurred on the NEM blockchain. Alex Tinsman was elected president of the foundation. Tinsman brings more than ten years of market experience as well as almost two years of experience as the regional head of foundations North American operations.
The NEM community was subsequently asked to vote on a NEM Foundation funding proposal, asking for 160 million tokens, which was about US$7.5 million. Of the 573 people who voted on the proposal, 90% supported the foundation's request. The proposal gave the Foundation and NEM Labs 210 million XEM for operations through February 2020.
The NEM blockchain consists of two components; the node, or NEM Infrastructure Server (NIS), and a client used for node interaction. For consensus, the NEM blockchain uses Proof of Importance (PoI) to determine which nodes are eligible to add a block to the blockchain, a process NEM calls "harvesting." Any nodes which harvest blocks receive the transaction fees for that block. The number of transaction fees per day in USD has declined significantly since January 2018, and is currently just under US$100 per day.
Source: coinmetrics.io
PoI aims to improve on Proof of Stake (PoS) by identifying which accounts support the network, as opposed to just hoarding coins. The NEM blockchain does this by creating a PoI score based on three metrics; vesting, transaction partners, and the number and size of transactions in the last 30 days.
A NEM account must first have 10,000 XEM in their balance to be scored, which is similar to masternodes on other PoS chains. The higher the number of vested coins, the higher the account's PoI score. Additionally, PoI only counts coins that have been in an account for a set number of days.
NEM went on to announce a discrete supernode program in December 2016. Each masternode requires three million XEM, with a disbursed daily payment of 70 XEM split between any working supernodes. Currently, 503 addresses qualify.
A PoI score also increases when users make transactions with other NEM accounts on the network. Users cannot game the network by trading back and forth, as the algorithm only accounts for the net transfers over time. Each transaction, above a minimum size, also increases the PoI score, with large and frequent transactions having a greater impact.
Other features of the NEM blockchain include; a notary, reputation scoring, namespaces, smart assets, and multi-signature transactions. The notary system, Apostille, can be used to make timestamps by creating data-specific transaction keys. The peer-to-peer reputation system, Eigentrust++, monitors the past behavior of nodes within the network and ensures confidentiality as well as authenticity of transactions.
Namespaces use a domain naming system similar to the internet's centralized ICANN domain name system. Within namespaces, there are higher level domains and subdomains, allowing one entity with one domain to create many different subdomains for different projects or outside business accounts. Smart Assets, similar to Ethereum's ERC-20 protocol, allows users to create mosaics which can represent any asset.
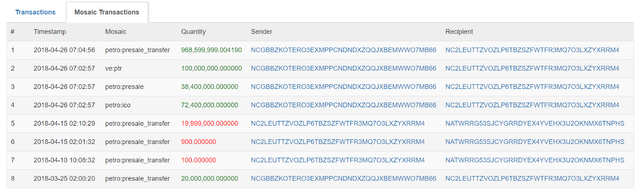
Although the NEM chain has hosted very few ICOs, the most notable has been the PetroDollar, a cryptocurrency created by Venezuelan president Nicolás Maduro with the help of Russian businessmen and officials. The Petro ICO ended in late March 2018, and reportedly raised US$5 billion, according to Maduro. In response, U.S. President Donald Trump signed an executive order banning the use of digital currencies that benefit the Venezuelan government. Most of the PetroDollar balance resides in a single NEM address with another address showing several outgoing transfers in May 2018.
According the to NEM rich list, the top 100 accounts own 62.5% of all tokens, which includes several exchange wallets and developer funds. The top account, labeled "Post-V1 Fund - 400 - Fund stakes", holds 900 million XEM, or 10% of all tokens in circulation. The Japanese exchange Zaif holds the most XEM amongst exchanges, with 782 million XEM, or 8.7% of all tokens in circulation. In September 2018, Zaif was hacked for US$60 million in Bitcoin, Bitcoin Cash, and MonaCoin. No XEM funds were stolen.
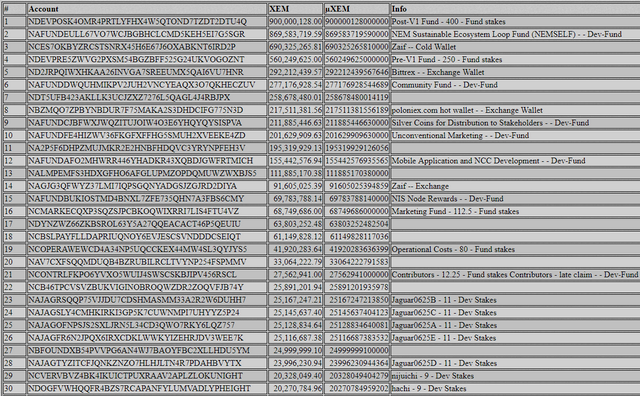
Source: https://nemnodes.org/richlist
In January 2018, Coincheck, another Japanese exchange, experienced losses totalling US$534 million after hackers were able to steal the private key for the exchange's XEM hot wallet. Then NEM Foundation president Lon Wong dubbed the hack "the biggest theft in the history of the world", exceeding the Mt. Gox hack by US$50 million. All 260,000 affected Coincheck customers were compensated for the loss at a rate of 88.54 JPY per NEM token, lower than the 110 JPY value at the time of the heist. Overall, Coincheck returned US$435 million to customers using the exchange's own funds.
Initially, the NEM Foundation added a tracking mosaic to monitor the stolen funds to reduce the ability to liquidate the funds, but this label was removed from the network in late March. Although forking the network was an option to restore the funds, the NEM Foundation felt this was a non-starter considering the theft was an exchange security breach and not the fault of the NEM blockchain. To date, there have been no suspects named in any investigation into the theft.
The NEM network has 443 nodes, 97% of which are using the latest version and most of the nodes reside in the U.S., Germany, and Japan. The current number of transactions per day (line, chart below) has been steadily growing since the April 2018 low. Transactions per day have not exceeded the high of 20,000 recorded in April 2015. The average transaction value per day has fallen from US$429,000 in late January 2018 to just under US$600. The average transaction fee has fallen dramatically over the course of 2018 and early 2019, from US$4.00 in January 2018 to US$0.00838 currently (not shown).
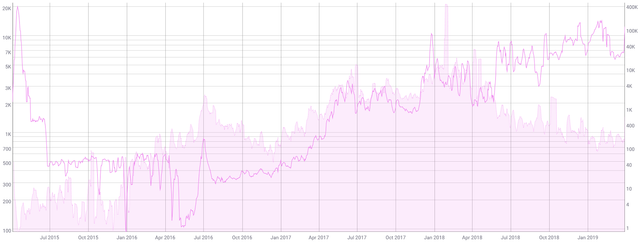
Source: coinmetrics.io
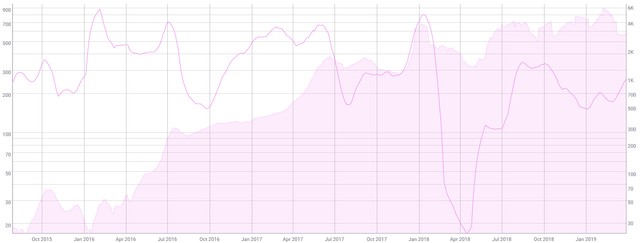
The 30-day Kalichkin network value to estimated on-chain daily transactions (NVT) ratio (line, chart below) has increased dramatically from the record low of 16.8 in April to the current 258. Historically, NVT has ranged from 150 to 700.
Inflection points in NVT can be leading indicators of a reversal in an asset's value. A clear uptrend in NVT suggests a coin is overvalued based on its economic activity and utility, which should be seen as a bearish price indicator, whereas a downtrend in NVT suggests the opposite.
Daily active addresses (fill, chart below) have had a gradual but sustained rise since early 2016, and are currently just below 3,000. This metric is also on the higher end of the historic range, having reached a record high of 5,700 in early February. Active and unique addresses are important to consider when determining the fundamental value of the network using Metcalfe's law.
XEM has substantially fewer daily active addresses than most coins, near 6000, suggesting that a sudden rise in addresses would likely paint a bullish picture for the asset. In comparison, Bitcoin and Ethereum currently have 684,000 and 222,000 daily active addresses respectively.
Source: coinmetrics.io
Turning to developer activity, there are 32 repos for the NEM project on GitHub, most of which have been inactive for the past two years. The NEM Library Official Repository has been the most activity recently (chart below), although this repo has seen very little activity over the past year.
Most coins use the developer community of GitHub where files are saved in folders called "repositories," or "repos," and changes to these files are recorded with "commits," which save a record of what changes were made, when, and by who. Although commits represent quantity and not necessarily quality, a higher number of commits can signify higher dev activity and interest.
However, NEM is currently in the process of adding new protocol improvements, collectively called "Catapult," which was launched as beta software in March 2018. The accompanying "nemtech" GitHub contains 28 additional repos, including the NEM2-SDK. The update aims to bring improved scalability, aggregated transactions, and faster transaction times. Berlin-based Grégory Saive recently announced that he will be leading development for the NEM2 project, which currently has a detailed roadmap through 2019.
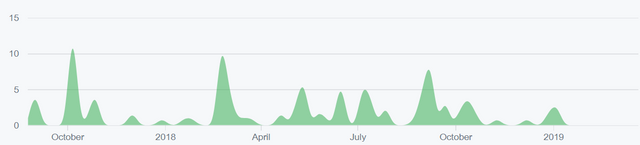
Source: https://github.com/NemProject/nem-library-ts/graphs/contributors
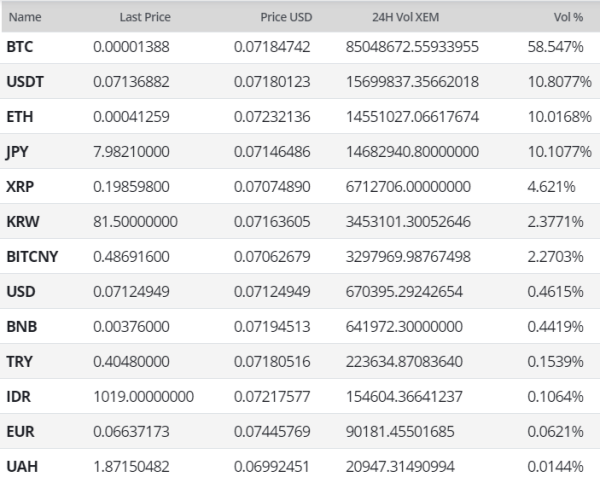
In the markets, XEM exchange traded volume in the past 24 hours has predominantly been led by the Tether (USDT) denominated markets. Other XEM pairs show little market deviation, except for the XEM/Euro pair which currently holds a premium of 4.39%. The majority of XEM trading on exchanges with verified volumes has occurred on Binance and Bittrex. Custody solutions include the native NEM wallet, NanoWallet, or hardware wallets such as Trezor.
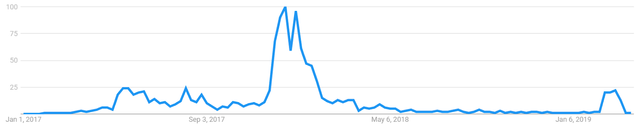
Google Trends data for the search term "NEM" has dropped substantially since mid-2018. A recent uptick in searches is likely related to the recent NEM foundation bankruptcy news. A slow rise in searches for "NEM" preceded the bull runs in 2016 and 2017, likely signaling a large swath of new market participants at that time. A 2015 study found a strong correlation between google trends data and BTC price whereas a 2017 study concluded that when U.S. Google "Bitcoin" searches increased dramatically, BTC price dropped.
Technical analysis
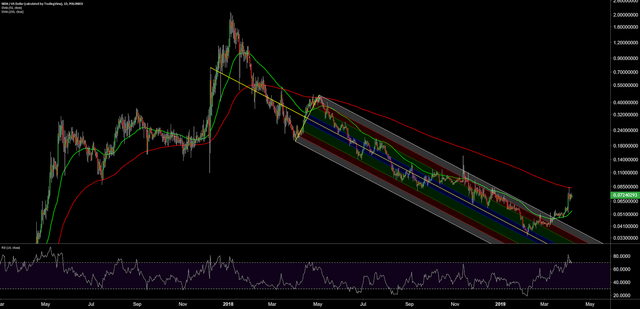
The XEM/USD spot price has slowly been grinding higher over the past few weeks, and is up over 65% from the local low in February. As the market makes a definitive decision on a bullish reversal, roadmaps for price can be found on high timeframes using exponential moving averages (EMAs), Pitchforks (PFs), Ichimoku Cloud, and volume profile (VPVR). Further background information on the technical analysis discussed below can be found here.
On the daily chart, a bearish 50 and 200 day EMA cross occurred in March 2018, with price being held below the 50 EMA for most of that period. Recently, price breached the 50 EMA, and reached for the 200 EAM at US$0.083. If price moves higher, the next move will very likely exceed the 200 EMA for the first time since February 2018, which would be indicative of a new bull trend.
Price had also been bound by a multi-month bearish PF with anchor points in December 2017, March 2018, and May 2018. A bullish breach of the PF, about 25 days ago, also suggests that the previous bear trend has ended. There are no RSI or volume divergences at this time.
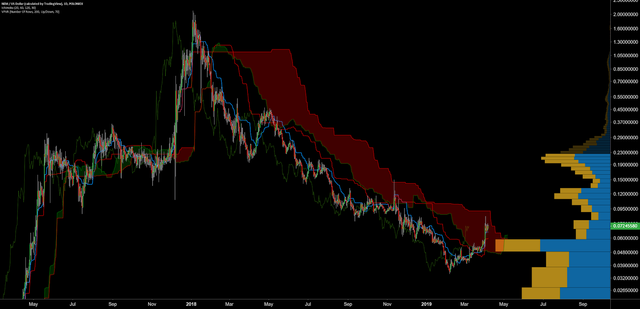
Turning to the Ichimoku Cloud, four metrics are used to indicate if a trend exists; the current price in relation to the Cloud, the color of the Cloud (red for bearish, green for bullish), the Tenkan (T) and Kijun (K) cross, and the Lagging Span. The best entry always occurs when most of the signals flip from bearish to bullish, or vice versa.
Cloud metrics on the daily time frame, with doubled settings (20/60/120/30) for more accurate signals, are neutral; price is in the Cloud, the Cloud is bullish for the first time since February 2018, the TK cross is bullish, and the Lagging Span is above the Cloud and above price. If XEM maintains bullish momentum, a near-term bullish target between US$0.09 and US$0.10 is likely based on the previous flat Kumos.
A traditional long entry will not trigger until price is above the Cloud, which has not been the case since January 2018. Over the next few weeks, price will likely breach the cloud, representing the first bullish Kumo breakout since December 2017.
VPVR (horizontal bars) shows significant volume support between the US$0.06-US$0.08 zone. Overhead resistance sits at the US$0.11-US$0.12 zone, with significant resistance at the US$0.20-US$0.21 level. Unsurprisingly, the US$0.10 and US$0.20 zones both represent psychological resistance as round numbers.
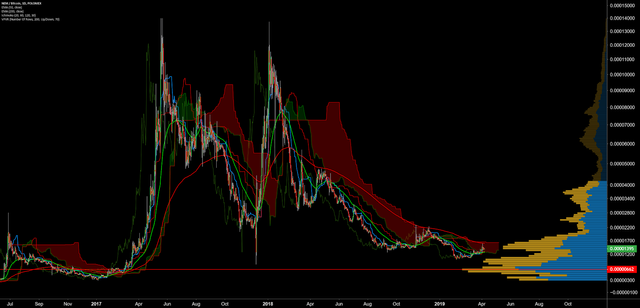
For the XEM/BTC pair, trend indicators also suggest a potential bullish reversal on the daily timeframe. A recent break of the 50 EMA should bring price to the 200 EMA, currently about 1600 sats. The Cloud is showing an active Edge to Edge trade, also with a target of 1623 sats. VPVR (horizontal bars) also shows substantial previous volume between 1400 sats to 1600 sats. A pending Kumo break and bullish 50/200EMA cross will likely signify additional bullish momentum in the coming weeks with VPVR showing significant resistance at 2500 sats and 3600 sats.
Conclusion
Network fundamentals are mixed as transactions per day are increasing while transaction values are decreasing. Daily active addresses are near record highs with NVT also rising substantially since April. Based on the NEM Foundation restructuring and reinvigorated push towards NEM 2.0 with the development of Catapult, 2019 will likely be a rebuilding year for the NEM blockchain. Despite being four years old, NEM-related projects have not gained garnered any significant limelight.
Technicals for both XEM/USD and XEM/BTC mirror that of the broader cryptocurrency market. After a multi-month decline throughout 2018, prices have again found bullish strength which will likely result in near-term mean reversion and the potential for a new bull trend. The XEM/USD pair shows a resistance zone between US$0.08-US$0.10, based on the 200 EMA and Cloud metrics with a multi-week target US$0.20. The XEM/BTC pair has a defined resistance zone near 1600 sats with very little volume history above this zone. Highs in both 2017 and 2018 exceeded 10,000 sats, suggesting this may also be a multi-week target.
Editorial Disclosure: Brave New Coin's parent company, Techemy Limited holds a quantity of XEM tokens.