Cryptocurrency and ICO Market Analysis (May 21-27, 2018)


This report presents data on the cryptocurrency and ICO market changes during 2018. Special emphasis has been placed on an analysis of the changes that have taken place in May 2018, including over the past week (May 21-27, 2018).
Information as of May 28, 2018
Professor Dmitrii Kornilov, Doctor of Economics, Member of the Russian Academy of Natural Sciences, and Leading Analyst at ICOBox
Dima Zaitsev, PhD in Economics, Head of International Public Relations and Business Analytics Department Chief at ICOBox
Nick Evdokimov , Co-Founder of ICOBox
Mike Raitsyn , Co-Founder of ICOBox
Anar Babaev , Co-Founder of ICOBox
Daria Generalova, Co-Founder of ICOBox
Cryptocurrency Market Analysis (May 21-27, 2018)
1. General cryptocurrency and digital assets market analysis (by week, month, quarter). Market trends
1.1. General cryptocurrency and digital assets market analysis (by week, month)
1. General cryptocurrency and digital assets market analysis (by week, month, quarter). Market trends
1.1. General cryptocurrency and digital assets market analysis (by week, month)
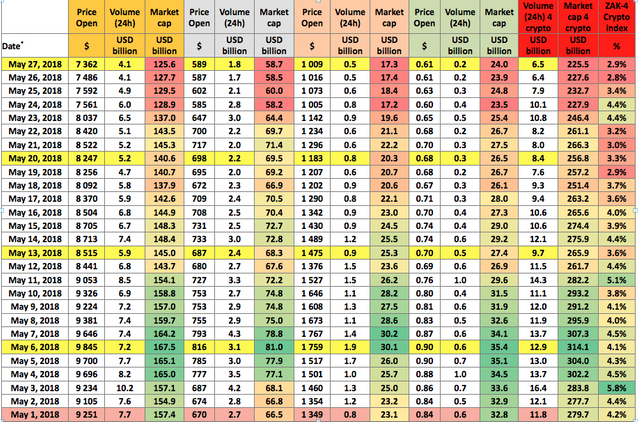
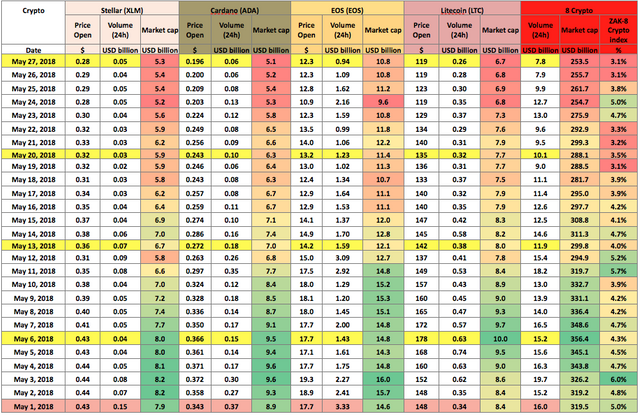
Table 1.1. Trends in capitalization of the cryptocurrency market and main cryptocurrencies from March 1, 2018, to May 27, 2018
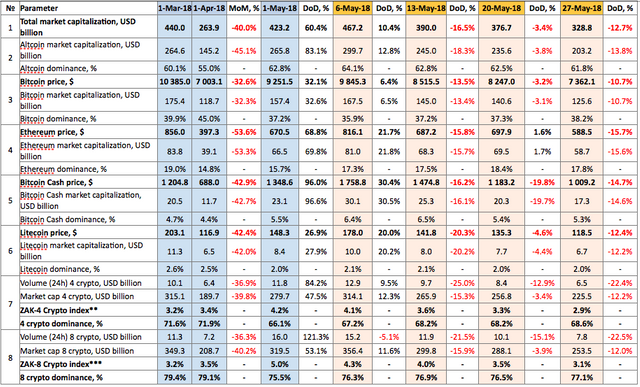

Over the past week (May 21-27, 2018) cryptocurrency market capitalization decreased, and as of 03:00 UTC on May 27 equaled $328.8 billion (see Table 1.1). The drop compared to the start of the month equals around $100 billion.
The dominance of the four and eight largest cryptocurrencies as of 03:00 UTC on May 27, 2018, equaled 68.6% and 77.1%, respectively, with bitcoin dominance increasing to 38.2% (see Table 1.1). Despite the overall reduction in cryptocurrency market capitalization, considerable growth was seen last week in the prices of certain cryptocurrencies from the third (top 500) echelon by capitalization, such as Docademic (+288%), Cashaa (+122.5%), ShareX (+51.48%), LALA World (+50.83%), Alphacat (+44.82%), Aurora DAO (+44.44%) and others.
Last week (May 21-27, 2018) cryptocurrency market capitalization fluctuated from $392.7 billion (max) to $320.1 billion (min) (Fig. 1), i.e. within a range of $72.6 billion. For its part, Bitcoin capitalization fluctuated from $145.9 billion (max) to $125.5 billion (min), i.e. within a range of $20.4 billion. In this regard, a very high correlation between the capitalization of the cryptocurrency market as a whole and Bitcoin has been seen for several weeks in a row (see Fig. 1). The maximum and minimum points and the overall configuration of the cryptocurrency market capitalization charts (with their characteristic “steps”) show an almost complete correspondence. There is a clear downward trend, and one gets the impression that it is not happening without market manipulation. Today (May 28, 2018) there was another fall by $17 billion over two hours, with cryptocurrency market capitalization falling to $310.7 billion. This collapse may be partially due to a sharp increase in the volume of trading in the pair ETH/USD on the bitfinex exchange.
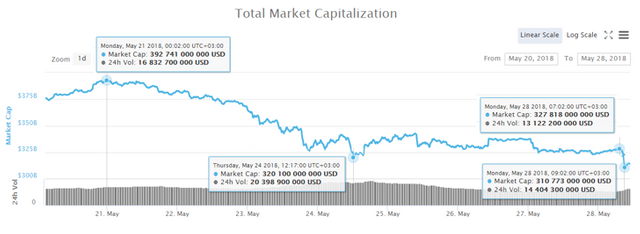
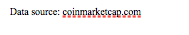
Figure 1. Capitalization of the cryptocurrency market and Bitcoin since May 21, 2018
The rise and fall of cryptocurrency prices over the past week (May 21-27, 2018)
During the period from May 21-27, 2018, the change in the prices of cryptocurrencies in the top 500 ranged from -63.63% (Fitrova) to +288% (Docademic).
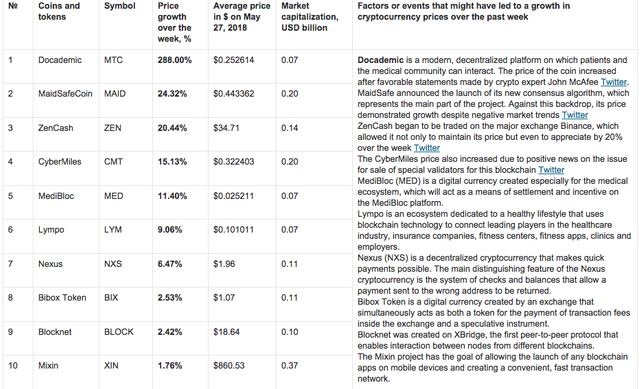
The price of Docademic also increased by 160% the week before last (May 14-20, 2018), i.e. over the past two weeks this cryptocurrency has seen a price growth of more than 400%. Docademic is a modern, decentralized healthcare platform on which patients and the medical community can interact. The price of the coin increased by a record 160% after the favorable statements made by crypto expert John McAfee (https://twitter.com/officialmcafee/status/998341903191076864).
The price of 50 cryptocurrencies and digital assets from the top 500 showed growth, including only eight from the top 100.
This past week the number of cryptocurrencies with a capitalization of more than $1 billion decreased from 25 to 22, with TRON being the only one to show a slight price appreciation (+1.71%). All the other coins showed a downward adjustment: Bytecoin (-30.30%), Zcash (-23.29%), Cardano (-20.06%), etc.
Total cryptocurrency market capitalization fell by 14% ($53 billion) over the week (below Fig. 1.1).
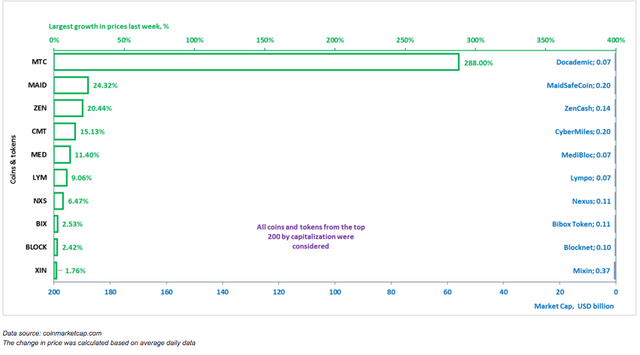
The coins and tokens from the top 200 that demonstrated the largest price growth are given in Fig. 2.
Biggest gainers and losers over the week (May 21-27, 2018)
The prices of some cryptocurrencies may fluctuate from -50% to +50% over the course of a single day. Therefore, when analyzing cryptocurrency price trends, it is advisable to use their average daily amounts on various cryptoexchanges.
Below we consider the 10 cryptocurrencies that demonstrated the most significant change in price over the past week (Fig. 2-3). In this regard, only those coins and tokens included in the top 200 (Fig. 2) and top 100 (Fig. 3) in terms of market capitalization (according to the data of coinmarketcap.com) were considered.
Figure 2. Largest growth in prices over the past week
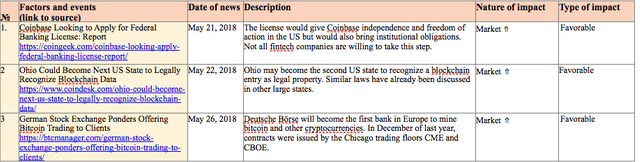
Tables 1.2 and 1.3 show the possible factors or events that might have influenced the fluctuation in prices for certain cryptocurrencies. Table 1.4 shows the possible factors or events that might have influenced the cryptocurrency market in general.
Table 1.2. Factors or events that might have led to a growth in cryptocurrency prices over the past week
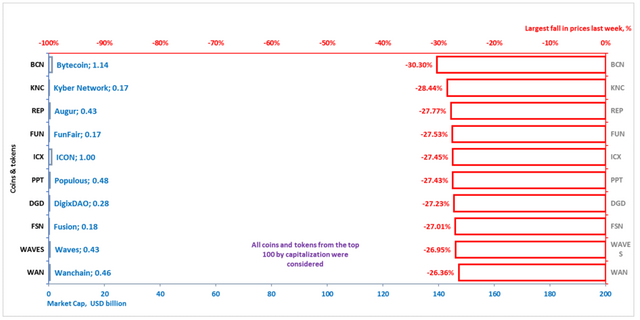
A depreciation in price was seen last week for 450 coins and tokens from the top 500 cryptocurrencies and digital assets by capitalization. The ten cryptocurrencies from the top 100 that experienced the most noticeable drops in price are shown in Fig. 3 and Table 1.3.
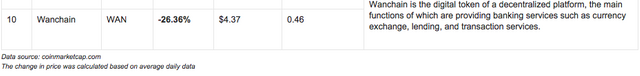
Figure 3. Largest fall in prices over the past week
**
Table 1.3. Factors or events that might have led to a fall in cryptocurrency prices over the past week**
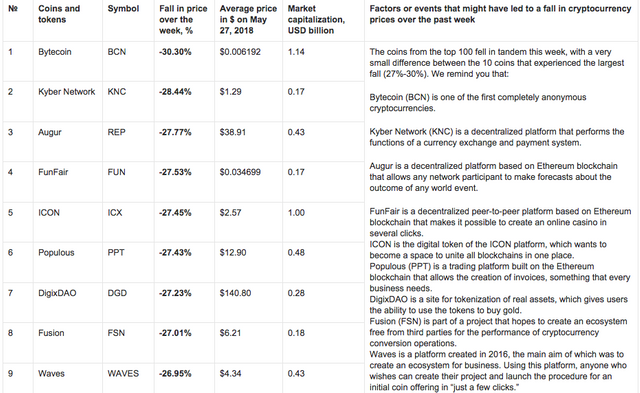
Cryptocurrency market capitalization only changed slightly over the week.
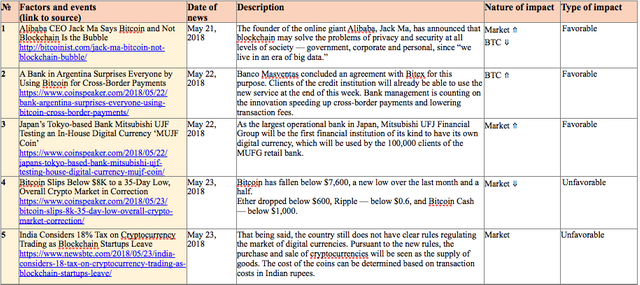
Table 1.4 shows events that took place from May 21-27, 2018, that had an impact on both the prices of the dominant cryptocurrencies and the market in general, with an indication of their nature and type of impact.
Table 1.4. Key events of the week having an influence on cryptocurrency prices, May 21-27, 2018
To analyze trading activity on cryptocurrency exchanges, the ZAK-n Crypto index is calculated (see the Glossary). The values of the ZAK-4 Crypto and ZAK-8 Crypto indices are presented in Tables 1.1, 1.5.a, and 1.5.b. In May the 24-hour trading volumes (Volume 24h) for the four dominant cryptocurrencies (Bitcoin, Ethereum, Bitcoin Cash, Ripple) equaled from $6.4 billion to $16.4 billion (Table 1.5.a). The value of the daily ZAK-4 Crypto fluctuated from 2.8% to 5.8% of capitalization. The highest trading volume was seen on May 3.
Table 1.5.a. Daily ZAK-4 Crypto index calculation (from May 1-27, 2018)
The 24-hour trading volumes (Volume 24h) for the eight dominant cryptocurrencies (Bitcoin, Ethereum, Bitcoin Cash, Ripple, Litecoin, Stellar, EOS, and Cardano) dropped to $7.8 billion by the end of last week (Table 1.5.b), or 3.1% of their market capitalization, i.e. trading volumes fell below the level at the start of the month. The ZAK-4 Crypto and ZAK-8 Crypto indices are considered in more detail in Tables 1.5.a and 1.5.b.
Table 1.5.b. Daily ZAK-8 Crypto index calculation (continuation of Table 1.5.а)
Starting on May 22, Huobi, one of the largest cryptoexchanges, began issuing the new consolidated HUOBI 10 index, which shows the trends of 10 digital assets with a high market value and liquidity. The digital assets are split into four categories: coins, platforms, applications, and asset tokens. The base point of the HUOBI 10 is 1000. The index has fallen by 100 points over the past five days, equaling around 900 points on the morning of May 28, 2018.
Table 1.6 gives a list of events, information on which appeared last week, which could impact both the prices of specific cryptocurrencies and the market in general.
Table 1.6. Events that could have an influence on cryptocurrency prices in the future
1.2. Market trends
The weekly cryptocurrency and digital asset market trends from December 31, 2017, to May 27, 2018, are presented as graphs (Fig. 1.1-1.5).
Table 1.7. Legends and descriptions of the graphs
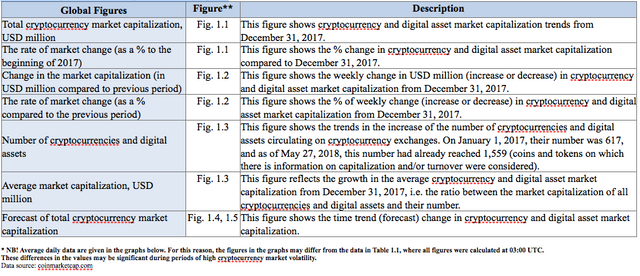
Figure 1.1. Total cryptocurrency market capitalization
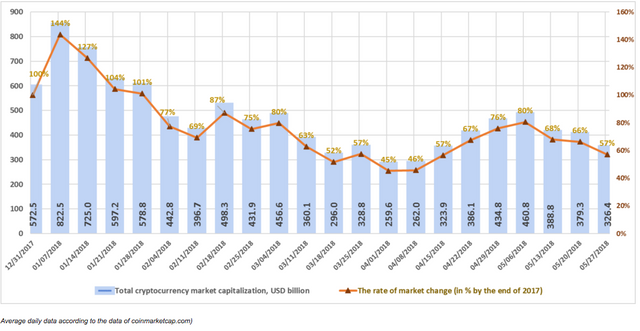
Figure 1.1 shows a graph of the weekly cryptocurrency market change from December 31, 2017, to May 27, 2018. Over this period, market capitalization dropped from $572.5 billion to $326.4 billion, i.e. by 43%. Last week (May 21-27, 2018) cryptocurrency market capitalization decreased from $379.3 billion to $326.4 billion (as of May 27, 2018, based on the average figures from coinmarketcap.com).
Figure 1.2. Change in market capitalization
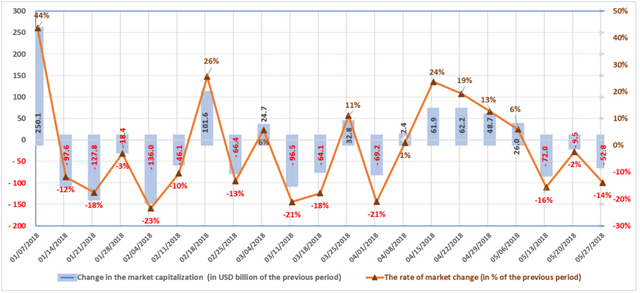
The market is susceptible to sudden and drastic fluctuations. During the first week of January, market capitalization increased by approximately $250 billion, or 44%. The largest weekly fall in the first quarter of 2018 equaled $136 billion, or 23%, during the period from January 28-February 4, 2018.
Nine of the thirteen weeks in the first quarter of 2018 were “in the red”, i.e. capitalization fell based on the results of each of these weeks. In the second quarter, the market grew over the first five weeks, followed by a three-week downward adjustment. During the period from May 6-13 the market regressed by 16% (-$72 billion), then by another 2%, and last week the fall equaled around 14%, or $52.8 billion (with due account of average daily data, see Fig. 1.2).
Figure 1.3. Number of cryptocurrencies and digital assets
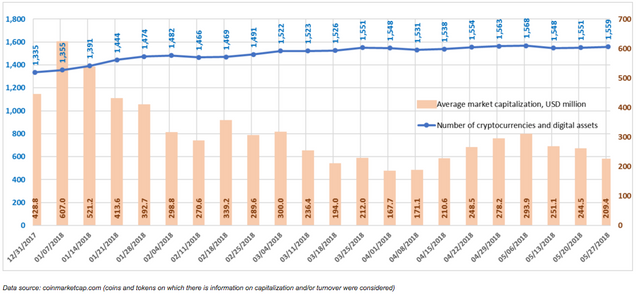
Since December 31, 2017, the total number of cryptocurrencies and digital assets considered when calculating market capitalization has increased from 1,335 to 1,559. Over the past week their number increased by eight, from 1,551 to 1,559, and average capitalization equaled $209.4 million. In total, over the past month 90 new coins and tokens have appeared on coinmarketcap.com. However, it should be noted that a number of other coins and tokens were also excluded from the list. From among the tokens that were added to coinmarketcap.com last week, Libra Credit, Patron, IoTeX, RED, Silent Notary, and Open Platform showed high trading volumes.
Figure 1.4 and 1.5. Forecast of total cryptocurrency market capitalization
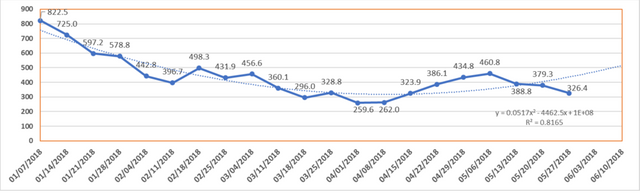
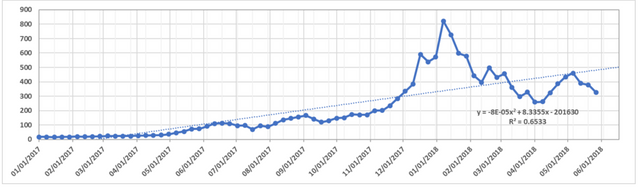
The Consensus 2018 conference held in New York on May 14-16, 2018, which was expected to cause new positive trends, did not result in a growth in cryptocurrency market capitalization, with the downward adjustment of the cryptocurrency market over the past three weeks equaling around $140 billion. There were many “favorable” and “unfavorable” information events during this period. We give several of them below that could have led to a fall in capitalization:
- The authorities in Thailand published a draft law on regulation of cryptocurrency circulation that entered into force on May 13. According to this law, all sellers of cryptocurrencies will be required to register with the Security Exchange Commission (SEC) [1];
- The investigation into allegations of fraud (falsification of balance sheets and deceiving investors) continues at Upbit, one of the largest cryptoexchanges in South Korea. The Financial Supervisory Service (FSS) has been joined in the investigation by the Financial Services Commission (FSC) [2];
- Court proceedings related to the ban by the Reserve Bank of India (RBI) on other banks providing services to cryptocurrency exchanges are underway in India. Several petitions have been filed with the Supreme Court, and hearings have been scheduled for July 20 [3];
- The Indian authorities are introducing an 18% tax on cryptocurrency trading [4]
- On May 24, the Monetary Authority of Singapore (MAS) warned eight cryptoexchanges in the country not to facilitate trading in digital tokens classified as securities or futures contracts without the permission of the MAS. It also cautioned issuers of initial coin offerings (ICOs) of the need to comply with the rules of the SFA (Securities and Futures Act) [5]
- The British Financial Conduct Authority (FCA) will check the activity of 24 cryptocurrency firms to “determine whether they might be carrying on regulated activities that require FCA authorization” [6];
- South Korea is beginning an investigation into ICOs [7], despite reports in March based on the data of The Korea Times that the financial authorities had prepared a plan that would make it possible to propose initial coin offerings (ICOs). You will recall that in September 2017 ICOs were banned in the country, but this did not stop local startups from collecting funds.
- A hacker stole $18 million in an attack on the Bitcoin Gold network.
One gets the impression that, on the one hand, the cryptocurrency market is experiencing a certain degree of media pressure in connection with the regulatory processes being implemented by the state authorities in several countries, and, on the other hand, that major players are taking part in price manipulation. All this against the backdrop of preparations of platforms for the entry of major institutional participants onto the market:
1.British broker Crypto Facilities launched trading of the first Ether futures in the world. According to company representatives, market participants can open both long and short positions and try to fill the gap in the market.
Pursuant to the data of coindesk.com, BitGo will open a cryptocurrency custodial service for institutional players. The cryptocurrency startup will offer three tiers of custody: “qualified custody”, offered through Kingdom Trust, “institutional custody”, allowing clients to manage wallets connected and disconnected from the internet, and self-managed custody.
2.Coinbase wrote in Twitter on May 15, 2018, “As institutions continue to enter the cryptocurrency market, we are committed to building the products and services that uniquely meet their needs”, i.e. the company has issued new products created especially for institutional players;
3.LMAX is launching a cryptoexchange for institutional participants. LMAX Exchange Group, the largest English fintech company and the owner of the LMAX Exchange (multilateral trading facility (MTF) for forex trading), announced on May 21, 2018, that it has introduced the first institutional exchange of five cryptocurrencies on LMAX Digital (Bitcoin, Bitcoin Cash, Litecoin, Ethereum and Ripple). At first the LMAX Digital infrastructure will operate at the London division, with plans to subsequently open LMAX Digital in Tokyo and New York.
4.Lightspeed Venture Partners is considering the possibility of creating a new cryptocurrency fund.
5.The main US market regulator (CFTC) has issued guidelines for cryptocurrency derivatives.
6.The German bank Deutsche Börse will be the first bank in Europe to add bitcoin futures and futures of other cryptocurrencies.
All these factors indicate that the cryptocurrency market can expect rapid growth over the long term in connection with the appearance of major institutional players who will fight for spheres of influence.
And, in conclusion, one more news item: the oldest Chinese bitcoin exchange is returning to the cryptocurrency market. BTCC will unveil a new exchange platform, the BTCC Exchange, in June 2018. The announcement of BTCC indicates that “Once launched, we will support trading pairs such as BTC, ETH, BCH, LTC / USD, ETH, BCH, LTC / BTC, etc.”
ICO Market Analysis (May 21-27, 2018)
1. General analysis of the ICO market (by week, month)
1.1. Brief overview of ICO market trends
1. General analysis of the ICO market (by week, month)
1.1. Brief overview of ICO market trends
Table 1.1. Brief ICO market overview, key events, news for the week of May 21-27, 2018
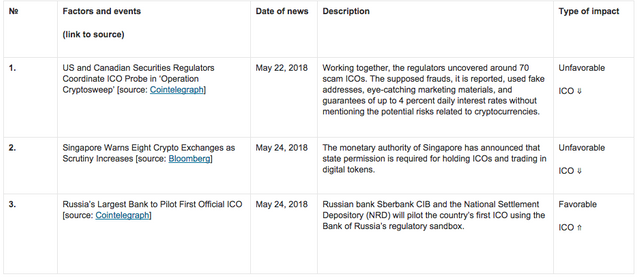
Table 1.2 shows the development trends on the ICO market since February 2018. Only popular and/or successfully completed ICOs (i.e. ICOs which managed to collect the minimum declared amount of funds) and/or ICOs listed on exchanges were considered.
Table 1.2. Aggregated trends and performance indicators of past (completed) ICOs1, 2
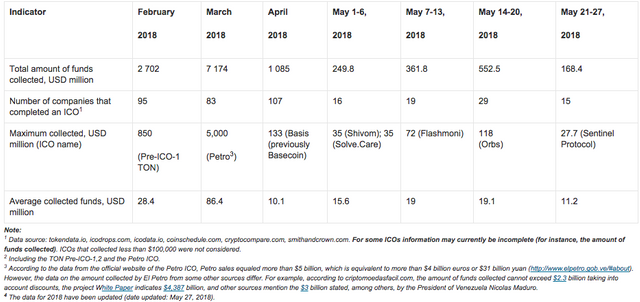
The data for the previous period (May 14-20, 2018) have been adjusted to account for the appearance of more complete information on past ICOs. Over the past week (May 21-27, 2018) the amount of funds collected via ICOs equaled $168.4 million. This amount consists of the results of 15 successfully completed ICOs, with the largest amount of funds collected equaling $27.7 million (Sentinel Protocol ICO). The average collected funds per ICO project equaled $11.2 million (see Tables 1.2, 1.3).
Table 1.3. Amount of funds collected and number of ICOs
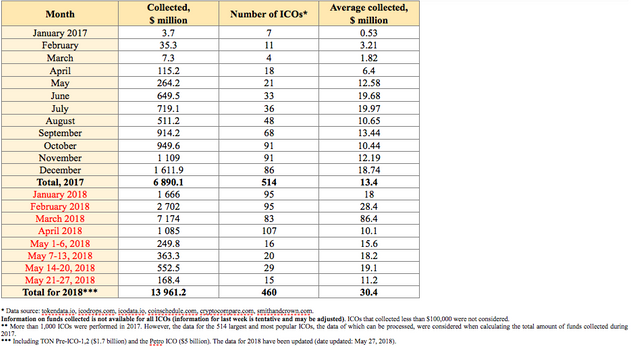
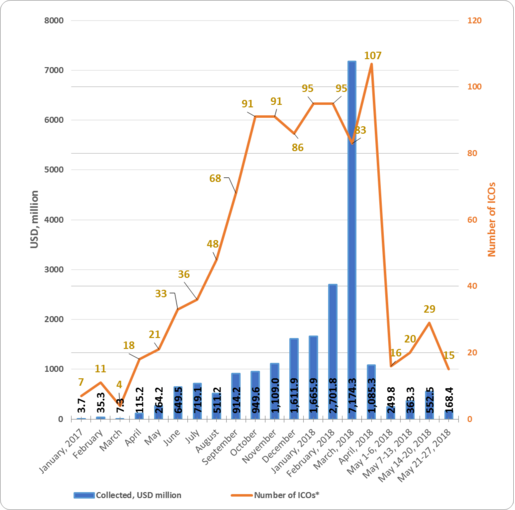
Table 1.3 shows that the largest amount of funds was collected via ICOs in March 2018, mainly due to the appearance of major ICOs. The highest average collected funds per ICO was also seen in March 2018.
Figure 1.1. Trends in funds collected and number of ICOs since the start of 2017
1.2. Top ICOs of last week
Table 1.4 shows the ten largest ICOs of the week.
Table 1.4. Top 10 ICOs in terms of the amount of funds collected (May 21-27, 2018)
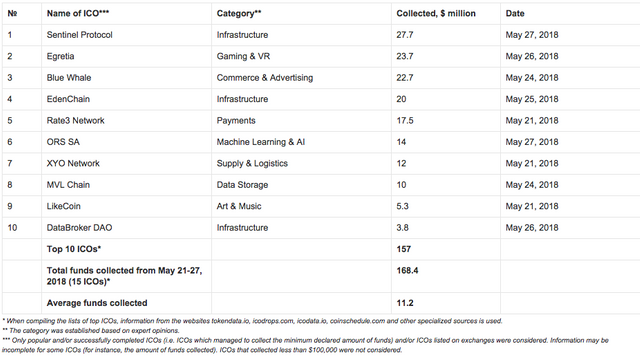
The data for the previous period (May 21-27, 2018) may be adjusted as information on the amounts of collected funds by completed ICOs is finalized.
The leader of the week was a timely and necessary project for the cryptocurrency market, the Sentinel Protocol project (UPP tokens). This project is the first cybersecurity platform of its kind, which operates according to the blockchain principle and is aimed at protecting crypto assets from hackers and fraud. The Sentinel Protocol envisages the creation of a global alliance for information exchange on threats with built-in incentives for all suppliers that contribute to the Threat Reputation Database (TRDB). The Sentinel Protocol has three security functions: the threat reputation database (TRDB), an integrated security wallet (S-wallet) powered by machine learning, and an isolated environment for malware analysis.
The sale of UPP tokens at the Presale and Crowdsale was completed in less than five minutes.
Figure 1.2 presents the ten largest ICOs completed during the past week.
Figure 1.2. Top 10 ICOs in terms of the amount of funds collected (May 21-27, 2018)
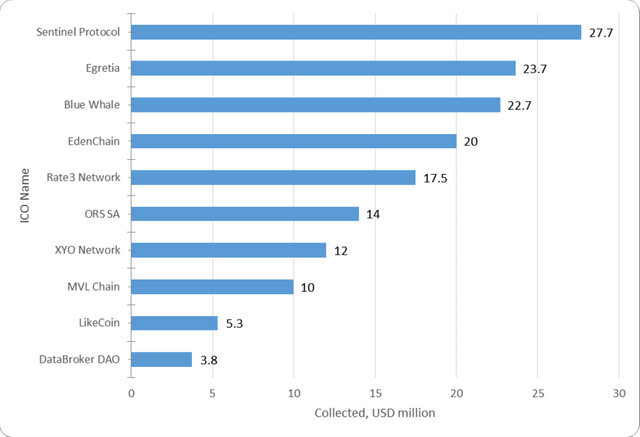
There is no direct resemblance between the leader of the week, the Sentinel Protocol project, and the other projects, but it can be compared with several similar ICOs in the area of privacy and security (see below)
1.3. Top ICOs in the Privacy & Security category
The list of top ICOs by category is compiled with due account of the categories of the leading ICOs for the week (Tables 1.5).
Table 1.5. Top 7 ICOs in terms of the amount of funds collected, Privacy & Security category
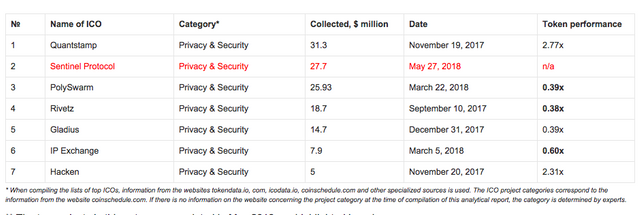

The leader of the last week, the Sentinel Protocol project, took second place in the Privacy & Security category in terms of the amount of funds collected. At present, all projects from the top 7 in this category have a token performance indicator of 0.39x to 2.77x. The leader in the category, Quantstamp, is the most successful exchange listing among those presented, as it has a current token price to token sale price ratio of 2.77x. When considering this indicator, it is important to remember that the Quantstamp ICO was completed on November 19, 2017, i.e. the 2.77x growth took place over five months. Its current capitalization exceeds $100 million.
Figure 1.3. Top 7 ICOs in terms of the amount of funds collected, Privacy & Security category
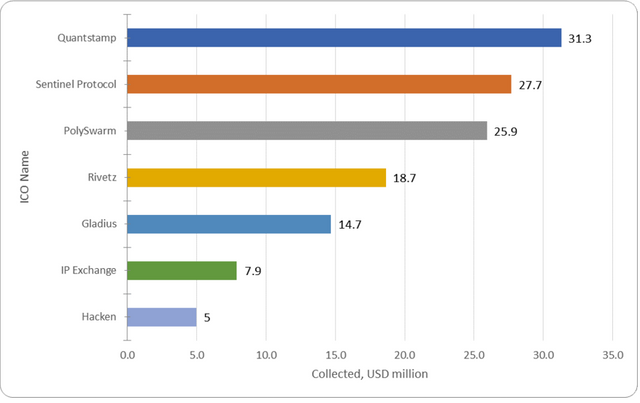
During the analyzed period (May 21-27, 2018) at least 15 ICO projects were successfully completed, each of which collected more than $100,000, with the total amount of funds collected equaling around $170 million. Last week’s leader was the Sentinel Protocol project, which collected $27.7 million. The total amount of funds collected by a number of ICOs failed to reach even $100,000 (the information for some projects is still being finalized).
The Glossary is given in the Annex.
Annex
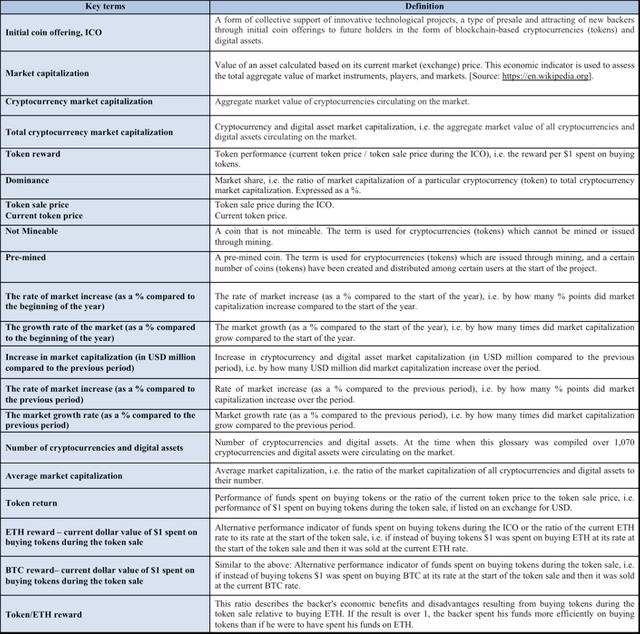
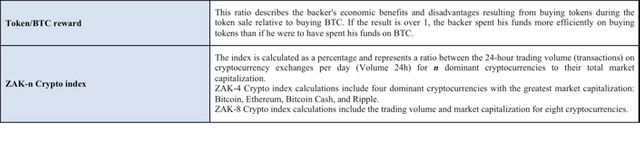
Glossary