Grassroot Crypto Education | Series 2 Volume 3 - Introduction to Technical Analysis (First Part)
Introduction
It's a great pleasure to be writing another piece for the kids in the community today, in continuation of our grassroot crypto education. In the previous lectures, we have discussed a lot about cryptocurrency, DeFi, NFTs, and so. We would be moving to another important section in cryptocurrency as such we will talk about Technical analysis and its components.

Designed with Adobe Photoshop
What is Technical Analysis?
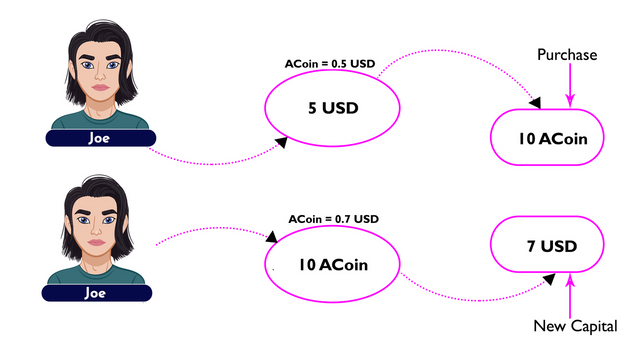
In one of the previous lectures, we have discussed cryptocurrency trading which is sometimes carried out for profitability or money movement. We highlighted a trader can choose to buy an asset when it's low and sell when its price appreciates to make some profits or sell off assets to get the desired asset to be utilized for a particular purpose, whichever way it's done, it's a form of cryptocurrency trading. If you missed that lecture, you can find it below.
Cryptocurrency Trading by @fredquantum
Involving in cryptocurrency trading for profitability requires the use of different methods to analyze the market of such asset and one important method is technical analysis.
Technical analysis is the utilization of chart patterns to measure the price behavior of an asset over time. The price movement of the asset under study is shown to reveal highs or lows reached over that period of study. The result of the analysis is being utilized for entry into a market, as such trading in the crypto ecosystem goes beyond acquiring crypto assets without proper analysis.
Technical analysis helps crypto users to easily identify the state of the market, is the price of an asset appreciating or falling? All of these are seen as price behavior formed patterns on the chart, giving an overview of what has happened in the market and the current state of the asset's market. Price is represented with candlesticks, line, bar, and so on, on the crypto chart. The representation can be customized based on the traders' preferences.
If a user chooses to utilize candlesticks for his/her price representation, that makes it a candlestick chart pattern and so on. The whole concept of technical analysis looks complex from afar, especially for beginners but I will simplify it in the best possible way. The popular charting platform we would be utilizing today for our analysis is https://www.tradingview.com/chart. Let's see a crypto chart below.
_2.png)
https://www.tradingview.com/chart/
From the image above, that's what the chart looks like and those patterns you see are the price behavior of BTC/USDT at a certain period. By default, two candlesticks represent the buy/sell of an asset at a period. I have indicated two things above bearish candlestick in red, which indicates that traders are selling at that period of selling outweighs buying (bearish candlestick is the red color at default), in short, the volume of sell is winning at that point, and bullish candlestick which indicates that buying from traders in winning in the market at that moment (bullish candlestick is the green color at default).
Key Highlights of Technical Analysis
- It is utilized to have an overview of the price behavior of an asset over time on the chart.
- It helps in the identification of the state of a crypto market as well as the support and resistance points on the chart.
- It is also useful in predicting the future price of an asset based on the past behavior that has been realized from the chart pattern.
- The analysis result is utilized by traders to set up a trading strategy and project their entry and exit levels in a crypto market.
Bull and Bear Market in Cryptocurrency
These are two important states of a crypto market to be considered before a trader chooses to buy/sell in a market. The pattern formed on the chart tells if the price of a crypto asset is appreciating or losing value. Let's talk about these two.
Bull Market
Bull market is a short form of bullish market which indicates that it's a market that is associated with the rise of a crypto price, in other words, we say the market is in Uptrend. In a bull market, price moves upward with many green candlesticks, remember it's angled upward on the chart pattern and it's mostly associated with many consecutive green candlesticks. Let's see the bull market on the chart below.
_1.png)
https://www.tradingview.com/chart/
Take a look at the chart above, that's a bull market, it's associated with many green candlesticks and the pattern is inclined upward. This is an indication that the price of the asset under study is appreciating and a good time for traders to have their stored assets increased in value.
Bear Market
Likewise, this is the short form of the bearish market which indicates the state of a crypto market when the price starts falling and the asset loses some value. This is an indication of large sales of the asset which continually pulls the price down, it's associated with consecutive red candlesticks and the chart pattern is inclined downward. This is simply a bear market and assets stored earlier when the price was high lost value at this point, bear market is not always a good season for basic traders. Let's see it on the chart below.
_1.png)
https://www.tradingview.com/chart/
Taking a look at the chart above, the chart pattern is inclined downward with many red candlesticks. As a trader, if you see this type of pattern, know that the market is in the bear state and it's not a good time to buy (for basic traders) for profitability as the pressure of sales keeps piling, as such the asset keeps losing value.
Support and Resistance on the Crypto Chart
As a beginner that has just been exposed to the basics of technical analysis, you are expected to understand these terms, Support and Resistance, they are indications of the points where the price of an asset stops in market to trigger a move in another direction of the market. Let's take them one after the other.
Support on the Crypto Chart
A cryptocurrency market in a downtrend (bear move) is associated with red candlesticks downward, at a point where a green candlestick surface changes the direction of the market is referred to as support. In other words, Support is a point that stops the bearish move of a crypto market, as such the effect of the support can be the one with a lasting effect to send the market in the opposite direction for a long time or temporarily. It's identified at the bottom of the candlestick.
_1.png)
https://www.tradingview.com/chart/
Taking a look at the chart above, when the bear market was winning, there was an existence of some green candlesticks that serve as the support to stop further movement of the bear market. And the effect of the one shown above is a lasting one as the market moved in the opposite direction of the bear market.
Resistance on the Crypto Chart
Resistance is a point on the crypto chart where the price of an asset is hindered from continuing in the bull market, as such it sends the price of the market in another direction, this is an indication of sale of the asset by some of the traders that have held it earlier, for profitability. Also, resistance is often a red candlestick that stops/pauses the bull move of many consecutive green candlesticks. In addition, the effect of resistance can be lasting or temporary. Let's take a chart example below.
_1.png)
https://www.tradingview.com/chart/
From the chart above, you can see how the price of the asset met resistance at the upper part of a bull market to change the market direction. The effect of it in that chart is a lasting one, you can see how the bear market began its government from that resistance level.
You have many other things to learn about support and resistance. This is a brief overview of these important parts of the chart pattern, they can be taken from many points on the chart, not necessarily at the uppermost or lowest points on the chart, I have used the topmost and lowest points in this piece so that you can understand better. They are basically points where a pause/stop of a market state is triggered.
Conclusion
In conclusion, you have been exposed to technical analysis today, which is a method of analyzing the crypto market before you make decisions of acquiring more assets, and identify the state of the market from the chart pattern, and so on. I also talked about a few things about support and resistance, they are important parts of the crypto chart.
This is just a brief introduction to technical analysis, we would be talking about some of its components in the coming lectures. Do not see this as a hard one to embark on, I have simplified it to your level and it would be great if you get it right now as you tend to become one of the market analysts in the soonest future. I hope you had a great read today. If you are confused in any part of the lecture, before you make your entries, ask me questions in the comment section. Thank you.
Homework Task
- What is your understanding of Technical Analysis? Why is it Important?
- Explain Bull and Bear Markets in Cryptocurrency. What are Support and Resistance? (Also use https://www.tradingview.com/chart to give screenshots of the answers to this section).
Guidelines
- Write an article of at least 250 words. Keep your explanation as simple as possible.
- Include the tag #grassroot-educations2v3, #fintech, #steemexclusive, and your club status among the first 4 tags. Also, tag me @fredquantum in your homework entry.
- The participation in this lecture/homework task is open to everybody but only entries made by verified kids would be reviewed.
- I will check your articles and drop comments on the entries submitted now till 11:59 pm UTC, 24/04/2022.
Cc:-
@steemkidss
Amazing lecture from you again dear @fredquantum. The kids will surely benefit from this. Technical analysis is the main thing in crypto trading. Ones ability to analyze the market and know the movement of the prices as presented by the chart is very key to a successful trading. I wish the kids success in this
I appreciate you so much dear professor
It would be very lucky of them to utilize this kind of exposure at the age they are at the moment, these are some of the things we weren't exposed to when we were younger. It could have been a good source of generating some basic income while in the university.
I really hope if they combine this kind of knowledge with other lucrative skills like programming, they are just on the verge of a financial breakthrough with less burden on their parents and stand the chance to rule the world.
Thanks for your valuable comment on this, ma'am. I am glad to do this, and will definitely do more, it's a great pleasure to share whatever knowledge I've acquired with people, yes, I do feel fulfilled. Thanks once again.
That was a great lecture professor, I'm interested in crypto currency trading and don't know how to but I'm sure I have found the best venue to learn the skills I need.
Thanks for this and expect my entry soon
I'm glad you found this helpful and I hope you would follow subsequent ones to get used to trading tools in the crypto ecosystem.
Yes offcourse
Hello, @fredquantum. Your article has been supported using the @steemcurator05 account.
Greetings sir.
Here is my entry:
https://steemit.com/hive-139765/@david-o/grassroot-crypto-education-or-series-2-volume-3-introduction-to-technical-analysis-by-david-o
My entry: https://steemit.com/hive-139765/@binwaqas/grassroot-crypto-education-or-series-2-volume-3-introduction-to-technical-analysis-first-part