Burned tokens, rewards, and inflation summary December 31, 2022 - Total burn estimates: 207K STEEM/SP and 64 SBD
Steemit launched the #burnsteem25 initiative on May 22, and the corresponding rewards started being delivered to @null on May 29. Subsequently, on August 9, Steemit announced that they'd be monitoring post promotions daily. Here is the next weekly update with PowerBI charts to visualize the burned token-related statistics since those dates.
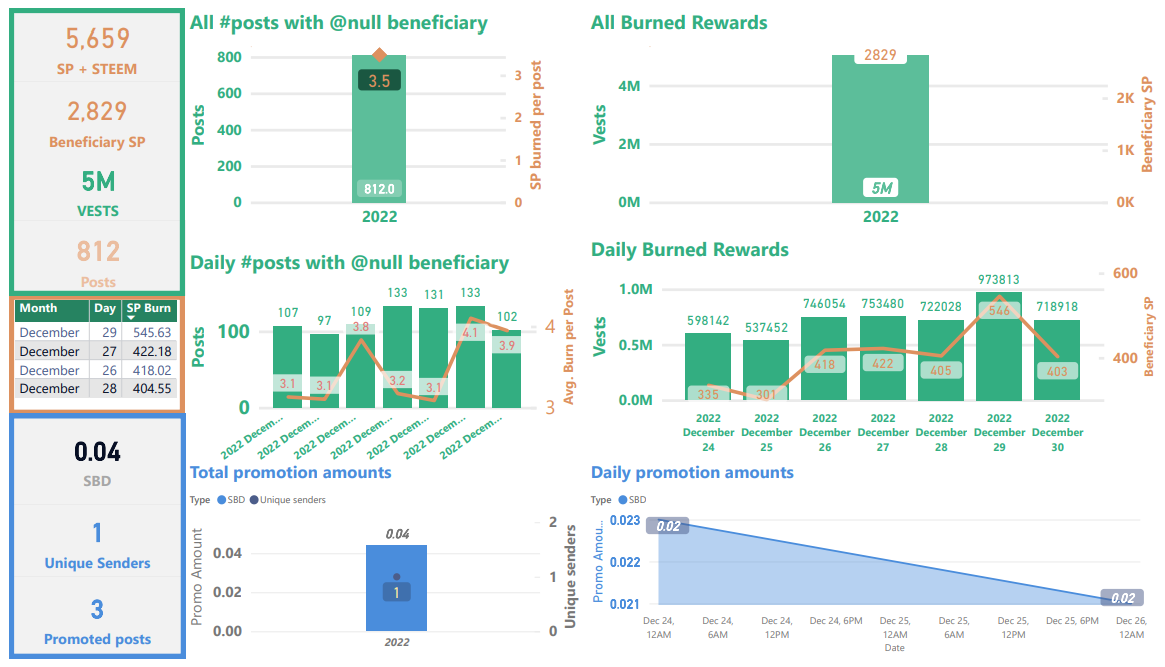
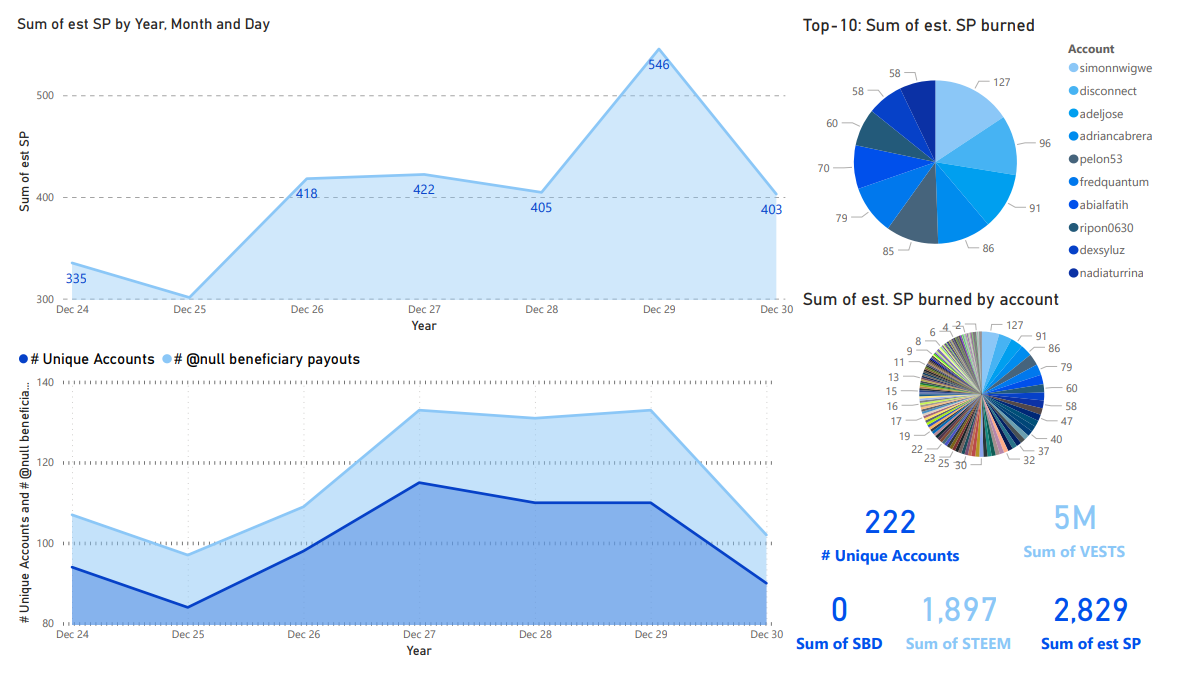
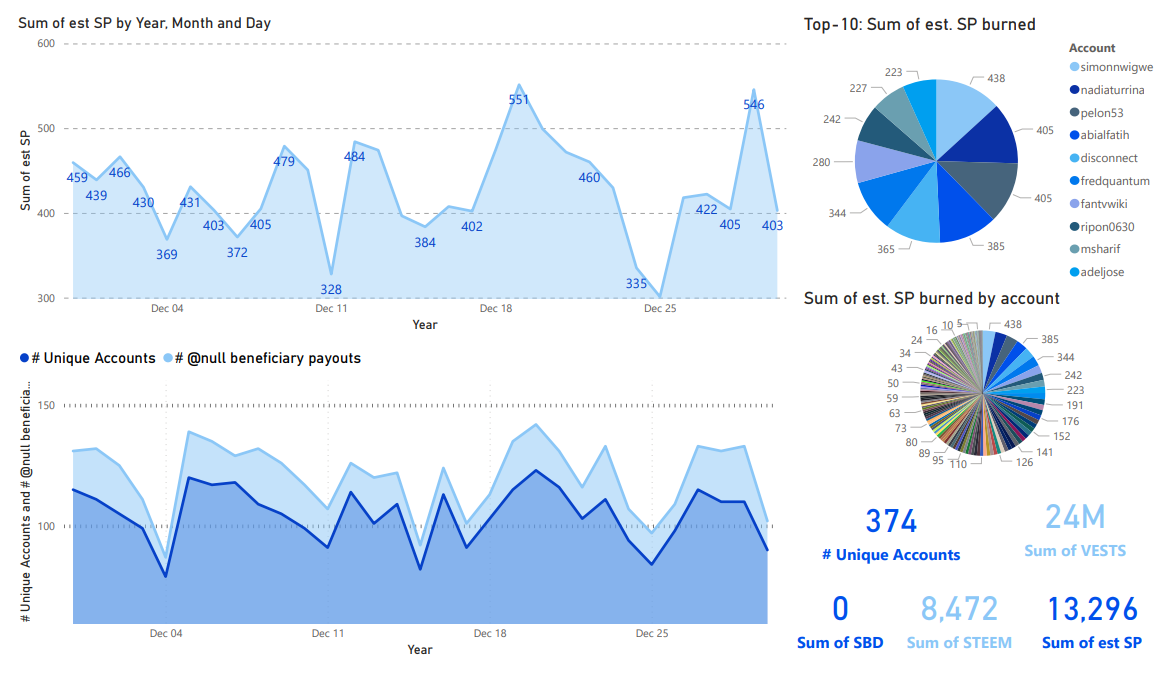
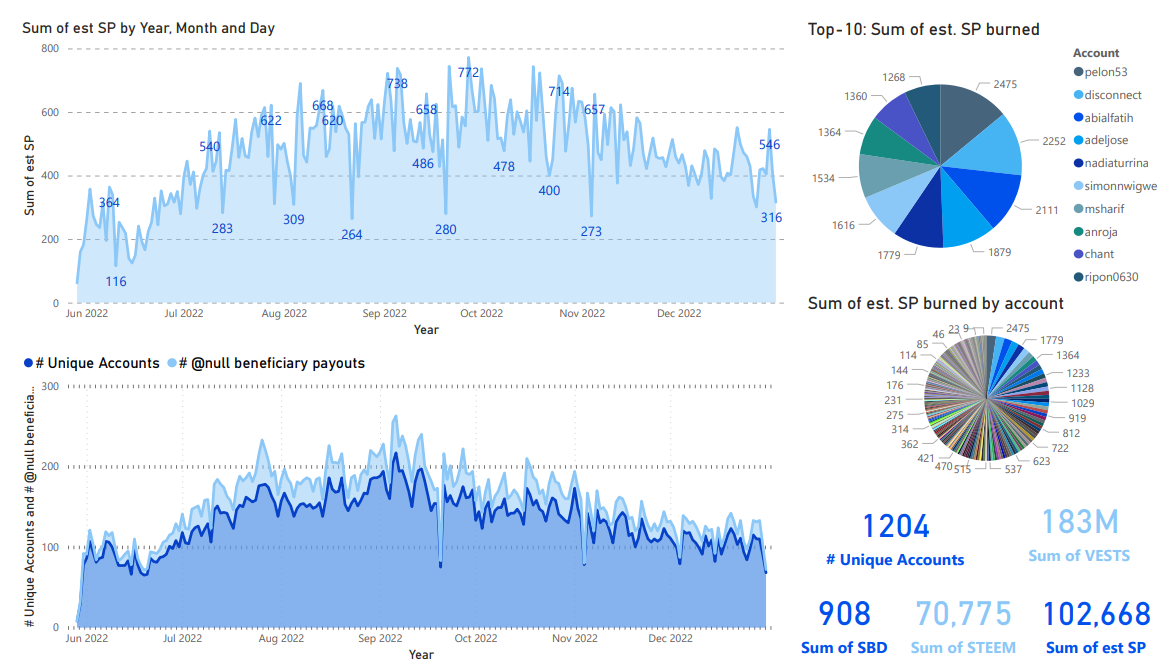
Slide 1 & 2: Burn amounts in beneficiary rewards and transfers to @null. (Weekly & All time)
Weekly totals were about 5,659 STEEM/SP in burned beneficiary rewards and 0.04 SBD burned on promotion with 812 burnsteem25 posts (~7 STEEM + SP burned per post). This is down by 951 from last week's 6,610. There were no new entries in the all time top-4 list. With last Sunday's Christmas holiday, I'm curious to see what today's totals wind up looking like.
Weekly
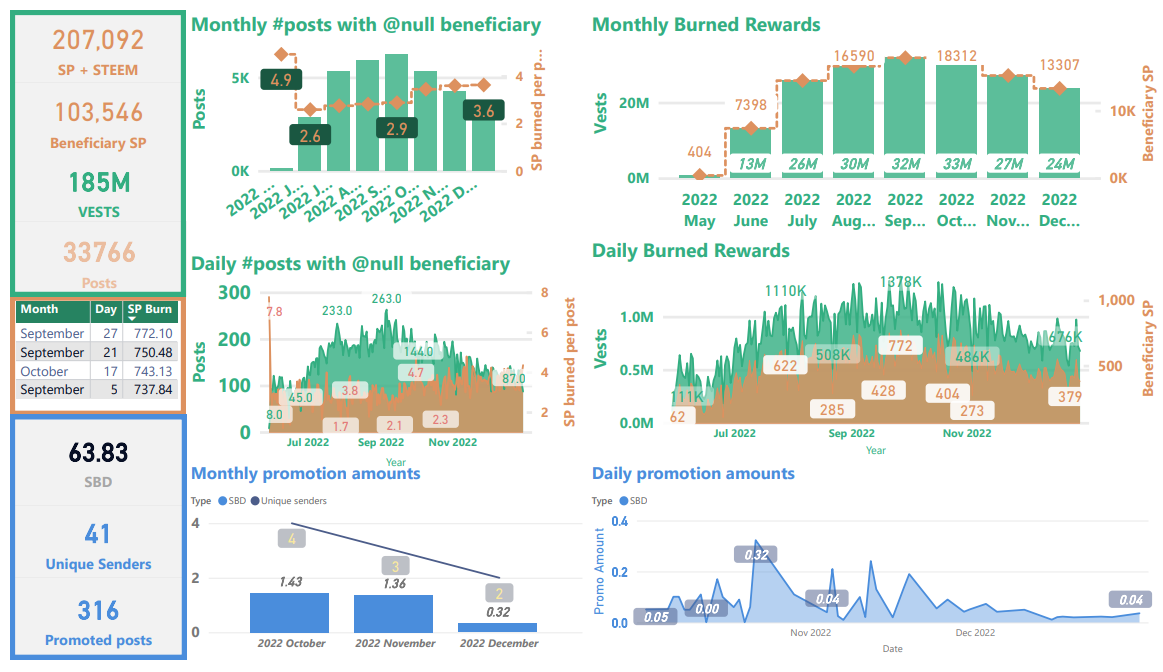
All time
| Sidebars |
|---|
Top sidebar summary cards show total number of STEEM, SP, and VESTS burned, as well as the total number of posts with @null beneficiary settings. This is where the headline number comes from.
In the center-left sidebar is a new table showing the top-4 days in terms of burned beneficiary rewards.
Bottom-left sidebar summary cards show totals for SBD burned in post promotion.
| Graphs |
|---|
Top-left is a graph showing the number of posts and average SP burned per post by month.
Top-right: This shows the VESTS and the estimated SP beneficiary rewards burned per month.
Middle-left: This is a graph showing the number of posts and average SP burned per post, by day.
Middle-right: This shows the daily VESTS and the estimated SP beneficiary rewards that have been burned.
In all of the above graphs, VESTS are shown against the left axis, SP and STEEM are shown against the right.
Bottom: SBD transfers to @null. As readers are likely aware, SBD transfers to @null can get a post added to the /promoted page. The visualization on the left shows a monthly aggregation of SBDs transferred and a count of unique senders. The visualization on the right shows the daily record.
Slide 3: Rewards summary
Unchanged from the last thirteen weeks is that SBD printing has remained paused due to continuing sluggishness impacting the price of STEEM (and crypto markets at large). With the present SBD supply, it looks like the median on-chain price for STEEM needs to get back to about $0.252 for SBDs to start printing again. With 91K burned and 5.04M in overall social rewards during the last 90 days, this represents an average burn rate of slightly more than 1.8%.
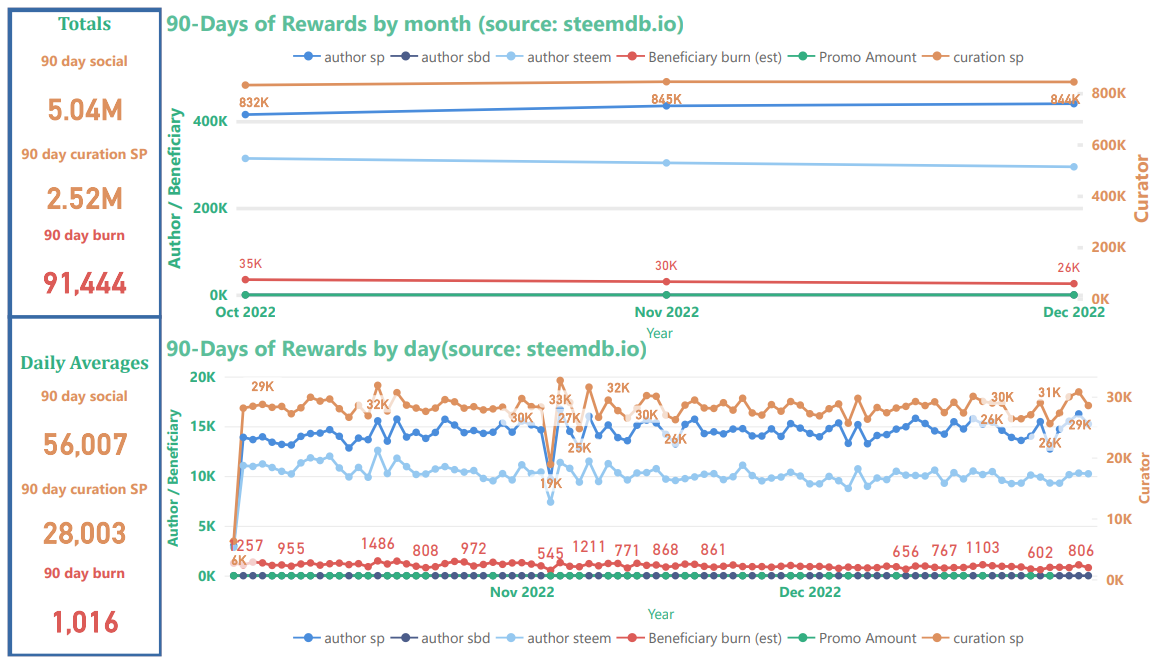
Curator rewards use the scale on the right, author and beneficiary rewards use the scale on the left. Thus, curation rewards appear to be scaled down relative to author & beneficiary rewards. Beneficiary rewards for @null in this chart (red) have been adjusted in order to account for both SP and liquid rewards. The top graph shows the monthly aggregations, and the bottom graph shows daily totals.
The new top-left sidebar shows estimates for the 90-day total of distributed "social rewards" (author, curator, and beneficiary), the 90-day total of curation rewards; and the 90-day total of burned beneficiary rewards.
The new bottom-left sidebar shows estimated daily 90-day averages for the same three values. In both sidebars, "social rewards" are calculated as [curation rewards] * 2. Based on these estimates, the burn rate is about 1.9% of all social rewards (this excludes interest paid for staking, rewards to witnesses, and SBDs to the SPS).
Slide 4: STEEM & SBD Supply as well as vested (i.e. staked or "powered up") STEEM
Noteworthy this week is that liquid STEEM as a percentage of current supply and of virtual supply increased slightly after declining last week (top-right and bottom-left charts). Also, the current blockchain inflation rate is now running around 6.81%, unchanged from last week and down from 6.89% when I started tracking it on November 26.
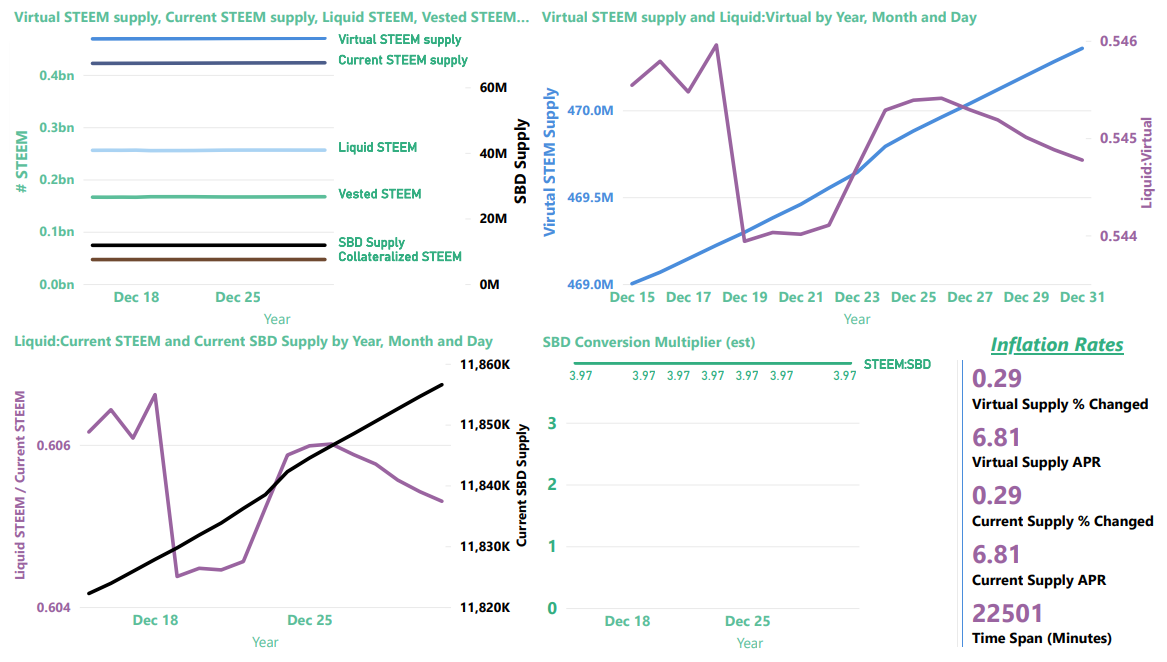
The card in the lower-right corner shows the inflation rates for current_supply and virtual_supply, as calculated from the SteemDB API.
The top-left image provides a summary view of current and virtual STEEM supply, current SBD supply, liquid and vested STEEM, and the amount of STEEM reserved as collateral for paying off SBDs.
| Note |
|---|
Collateralized STEEM and current SBD supply actually represent the same value expressed in terms of STEEM or SBDs, respectively. They're aligned differently on the graph because they use different axes. |
The top-right graphic now contains a zoom-in on "virtual STEEM Supply" (left axis) and the ratio of liquid STEEM / virutal STEEM supply (right axis). As we learned, here, virtual STEEM supply is heavily influenced by price, so with STEEM prices down, it's not surprising to find the virtual STEEM supply increasing. The up-side of this is that it's now possible to burn more collateralized STEEM per SBD with post promotion.
The bottom-left visualization now contains the ratio of liquid STEEM / current STEEM supply (left axis) and a zoom-in on Current SBD supply (right axis)
The chart on the bottom right shows the value of SBDs in terms of STEEM, according to the blockchain conversion rate, not external markets. This is the inverse of the blockchain's: internal price (which is different from the actual feed median, for reasons that I don't currently understand).
Now, here are some more details about each of the values
| Parameter | Axis (left/right) | Meaning | Comments |
|---|---|---|---|
| SBD Supply | right | Number of SBDs in circulation | Equivalent in value to collateralized STEEM |
| Collateralized STEEM | left | Number of STEEM needed to pay off all SBD debt | Equivalent in value to SBD Supply |
| Vested STEEM | left | Number of STEEM staked as STEEMPOWER | |
| Liquid STEEM | left | Number of STEEM that's not staked or needed for SBD collateral | Calculated as (Current STEEM supply - Vested STEEM) |
| Current STEEM supply | left | Number of STEEM in circulation | |
| Virtual STEEM supply | left | Number of STEEM in existence |
Slide 5-7
Last month, I started downloading the actual curation reward transactions from the blockchain, so I can see how well the numbers match up with steemdb. After 57 days of downloading, it's caught up to the present. Here are graphs from the last week, the last month, and the entire time period.
Last week
Last month
May 29 to present
These numbers are slightly different than the numbers from steemdb.io, probably because I didn't have any error handling for network "hiccups". One of these days, maybe I'll redo it with some better error handling, but this is what I have for now.
Thanks for reading!
For previous updates, see:
- Burned tokens, rewards, and inflation summary December 24, 2022 - Total burn estimates: 201K STEEM/SP and 64 SBD
- Burned tokens, rewards, and inflation summary December 17, 2022 - Total burn estimates: 195K STEEM/SP and 64 SBD
- Burned tokens, rewards, and inflation summary December 10, 2022 - Total burn estimates: 189K STEEM/SP and 64 SBD
- Burned tokens, rewards, and inflation summary December 3, 2022 - Total burn estimates: 183K STEEM/SP and 64 SBD
- Burned tokens, rewards, and inflation summary November 26, 2022 - Total burn estimates: 176K STEEM/SP and 63 SBD
- Burned tokens, rewards, and inflation summary November 19, 2022 - Total burn estimates: 168,687K STEEM/SP and 63 SBD
- Burned tokens, rewards, and inflation summary November 12, 2022 - Total burn estimates: 161,809K STEEM/SP and 63 SBD
- Burned tokens, rewards, and inflation summary November 5, 2022 - Total burn estimates: 154,548K STEEM/SP and 62 SBD
- Burned tokens, rewards, and inflation summary October 29, 2022 - Total burn estimates: 146,635K STEEM/SP and 62 SBD
- Burned tokens, rewards, and inflation summary October 22, 2022 - Total burn estimates: 138,248K STEEM/SP and 62 SBD
- Burned tokens, rewards, and inflation summary October 15, 2022 - Total burn estimates: 130,161K STEEM/SP and 61 SBD
- Burned tokens, rewards, and inflation summary October 8, 2022 - Total burn estimates: 121,925K STEEM/SP and 61 SBD
- Burned tokens, rewards, and inflation summary October 1, 2022 - Total burn estimates: 113,594K STEEM/SP and 61 SBD
- Burned tokens, rewards, and inflation summary September 24, 2022 - Total burn estimates: 104,675K STEEM/SP and 60 SBD
- Burned tokens, rewards, and inflation summary September 17, 2022 - Total burn estimates: 96,709K STEEM/SP and 60 SBD
- Burned tokens, rewards, and inflation summary September 10, 2022 - Total burn estimates: 88,781K STEEM/SP and 55 SBD
- Burned tokens, rewards, and inflation summary September 3, 2022 - Total burn estimates: 80,692K STEEM/SP and 54 SBD
- Burned tokens, rewards, and inflation summary August 27, 2022 - Total burn estimates: 71,850K STEEM/SP and 49 SBD
- Burned tokens, rewards, and inflation summary August 20, 2022 - Total burn estimates: 64,876K STEEM/SP and 37 SBD
- Burned tokens, rewards, and inflation summary August 13, 2022 - Estimated beneficiary burn since May 29: 56,855 STEEM
- Burned tokens, rewards, and inflation summary August 6, 2022 - Estimated beneficiary burn since May 29: 49,365 STEEM
- Burned tokens, rewards, and inflation summary July 30, 2022 - Estimated beneficiary burn since May 29: 42,556 STEEM
- Burned tokens, rewards, and inflation summary July 23, 2022 - Estimated beneficiary burn since May 29: 35,497 STEEM
- Burned tokens, rewards, and inflation summary July 16, 2022 - Estimated beneficiary burn since May 29: 28,408 STEEM
- Burned tokens, rewards, and inflation summary July 9, 2022 - Estimated beneficiary burn since May 29: 22,185 STEEM
- Burned tokens, rewards, and inflation summary July 2, 2022 - Estimated beneficiary burn since May 29: 15,312 STEEM
- Burned tokens, rewards, and inflation summary June 25, 2022 - Estimated beneficiary burn since May 29: 12,412 STEEM
- Burned tokens, rewards, and inflation summary June 18, 2022 - Estimated beneficiary burn since May 29: 8,994 STEEM
- Burned tokens, rewards, and inflation summary June 11, 2022 - Estimated beneficiary burn since May 29: 6,492 STEEM
Pixabay license, source
Reminder
Visit the /promoted page and #burnsteem25 to support the inflation-fighters who are helping to enable decentralized regulation of Steem token supply growth.
This post has been featured in the latest edition of Steem News...
If you like challenges, check out The Big 80 - launching soon with 80,000 SP in prizes...
Burning custom is really good. Despite these and similar good aspects, why is steem not worthy of what it deserves?
SBD printing has really stopped a long time ago. But I didn't know that for so long already, for 13 weeks.
Burning a coin really has a beneficial effect on its price. however, recently it has been consistently at low levels.
Thanks for the report.
Right, when the price of STEEM goes down, activity levels generally go down with it.
I wish you a happy day and also a happy new year