Tron Fan Club| Understanding Candlesticks, Charts, and Timeframe in Trading - By @solexybaba |10% payout to the community account
Image edited on Canva
Hello to everyone in this great community known as the Tron Fan Club I hope we all are in good spirits. I welcome you to yet another weekend here in this great community. Today I will be sharing with us an important topic, this topic will enhance our knowledge in trading cryptocurrencies. I have seen many newbies in the cryptocurrency world, trading without analyzing their charts and at the end of the day, they get to see their accounts bleeding so badly, and on seeing that scenario, I decided to bring the topic to others to be taught here by me. so I will be talking about Understanding candlesticks, charts, and timeframe in cryptocurrency trading. with this I believe by the end of this lesson, many newbies will learn and then know how to work with them accurately. so I beckon on you all to stay put as I drop my entry.
EXPLAIN WHAT CANDLESTICKS ARE?
In other to get a clear understanding of to trading of cryptocurrency, it is expected that we all get familiar with the necessary information regarding trading. getting a proper understanding before exhibiting your trad is necessary and as such gives you an edge over the market in other for one to make profits rather than losses.
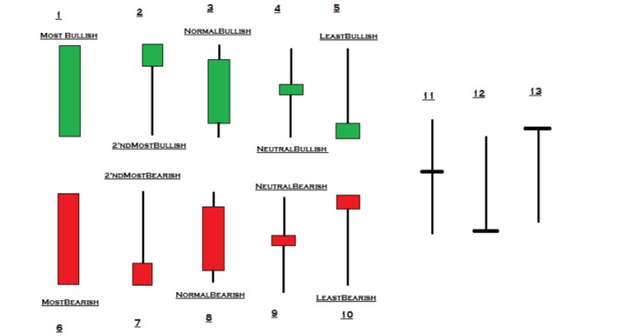
Candlesticks are seen to be the better way to analyze your trading chart, it is also called the Japanese candlesticks. the candlesticks help one to checkmate the market movements. also, we should all know that these Japanese candlesticks are of two categories, we have the red color candlestick and the green color candlestick. the red and green Japanese candlesticks are the only colors that can be found in the Japanese candlesticks.
The Red candlestick indicates the point where the sellers are in the cryptocurrency market and then the green candlestick shows the level of buyers present in the market. and again, if we notice the red Japanese candlesticks dominating the market, this indicates that the people selling are dominating the cryptocurrency market, while when we happen to see the green Japanese candlesticks, this implies that the people buying have dominated the market or are more present in the market. let us take an example from taking a clear chart from the tradingview.
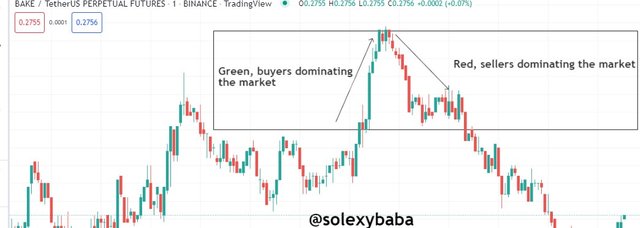
screenshot from Tradingview.com
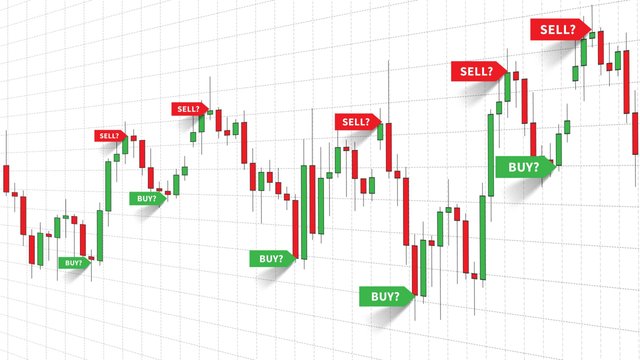
As we all can see from the chart above, the green color with the arrow pointing upward signifies that buyers are more dominant in the cryptocurrency market, while the red color with the arrow facing downward indicates that sellers are dominating the market. so with this, we get to know which people are currently dominating the market with the help of the Japanese candlesticks, and with that, we can then know the kind of position to take in other to take advantage of the market trend at that particular time of trading.
Also, we should bear in mind that the candlesticks have four parameters, and they are, Open, Close, High, and lastly the Low.
WHAT DO YOU UNDERSTAND BY THE WORD CHART?
The chart can be considered a well-designed graphics movement in which it shows us the amount of demand and supply regarding cryptocurrency trading, and also it assists a trader in taking a good analysis of the market before executing a trade in the cryptocurrency market.
With this chart that indicates the supply and demand of cryptocurrencies in a straight line helps traders to understand what is happening in the market in a super way. nd also it helps us to know and notice the buying or selling strength of cryptocurrencies by trades, with this we get to see what type of trade is being executed in the market and as well the agility and force they used to make the purchase or selling of the cryptocurrencies.
Note that the charts are normally paired alongside a currency, we can take a similar scenario such as the Bitcoin. it is paired also with USD and then it appears as a BTCUSD in the chart. so let us take a look at what a chart looks like using the cited example.
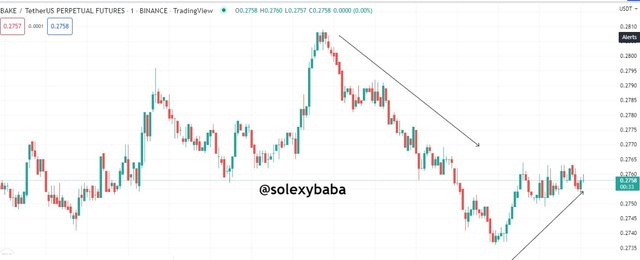
screenshot from Tradingview.com
From the example, as seen above, we get to see that the chart is depicting the level of supply and demand in the cryptocurrency market. the arrow facing downward indicates that sellers are more than buyers in the market and then the arrow that is facing upward shows that buyers are now dominating the market. so the chart shows clearly who is dominating the market alongside the power of domination.
WHAT DO YOU UNDERSTAND BY THE WORD TIMEFRAME IN TRADING?
The word timeframes are easily defined as the particular time we want to execute our trade of cryptocurrency in the market, the timeframes have several intervals on the chart, it helps to see what has happened in the market both currently and previously. we have several intervals like I said, we have the 5 min timeframe chart, 15 min timeframe chart, the 45 min, and even a day timeframe chart, all these timeframes chart shows the trading activity in their different intervals.
Again the timeframe charts show Red and Green, and if it only shows red, it means that sellers are more dominant in that particular time frame in the cryptocurrency market trading, and when it shows green, it implies that buyers are more dominant in the market at that particular time.
At this point, it is better to look at some examples of the timeframes chart at different intervals for easy understanding.
**5 min timeframe - Here we get to see what the market is doing with the use of 5 min time frame of the BAKEUSDT, and at this point, I then chose green and red candles in other to indicate that there are more trends other than the single candlestick.
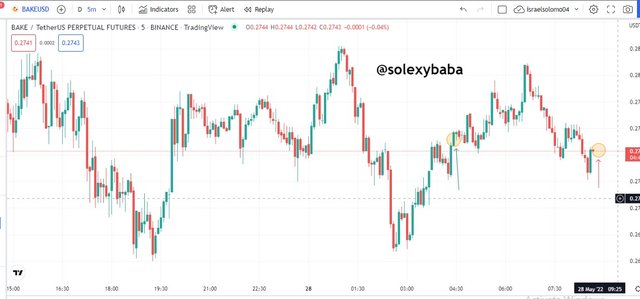
screenshot from Tradingview.com
The 1 min timeframe - As we can see, the candles I selected previously, it is now getting bigger and expanding in territory into a one-minute chart view, and as seen from the one minute chart, the previously selected candle is now distributed in 4 candlesticks, and as seen for the chart, the green colors are more than the red colors and with this forces the earlier selected candle to show just a single green candlestick alongside a red candlestick.
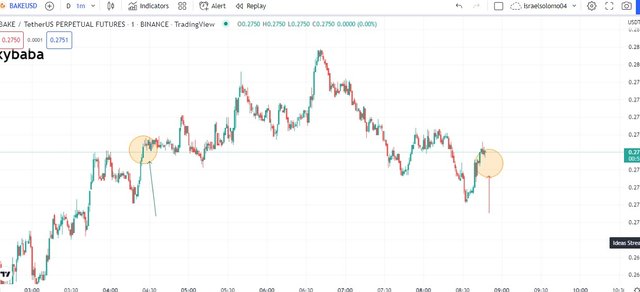
screenshot from Tradingview.com
It is very vital to understand the various timeframes as it helps traders to see what is happening and what has happened in the market as this will give them more confidence and then take advantage of the market trends.
CONCLUSION
I believe this vivid explanation, will guide especially newbies to know the meaning of candlesticks, chart analysis, and the various timeframes in the cryptocurrency trading market. it is recommended that before one is to execute trading, that they know these things as though it will give them an edge on the movements which the market is exhibiting, and then we can as traders can now decide what decision to take. with the help of the chart, seeing the dominance of the market by either the sellers or the buyers, we then tend to make the right decision on which other to place in the market.
Thank you all for your time, see you in my next article.

Twitter shared
Check out Israel Solomon (@IsraelS49407699): https://twitter.com/IsraelS49407699?t=Y9qfRWupIwgv45Z4B_LCWw&s=07
You have done well in your explainations as they are very detailed.
Thank you for your tutorial
Thank you sir for your kind words
Note: You must enter the tag #fintech among the first 4 tags for your post to be reviewed.
Thank you so much for stopping by @fredquantum
Friends your explainations was very nice. Thanks for sharing with us
Thanks for details. Nice explanation
Thank you sir for your kind words. Greetings!
This is beautiful i must say. I love the fact that you combined the topic and dealt with it extensively.
Thank you so much sir for your kind words!
You have created a very important lesson with Candlesticks, Charts, and Timeframe in Trading. These are the major requirements for a successful Trader, So, thank you very much for sharing your valuable knowledge with us.
Thank you eo much for stopping by. I am glad you liked it
Interesting article
Thank for sharing 😊😊
Thank you for following. Greetings
Wow you perfectly explained all the concepts well to my understanding. The use of time frames, indicators and candlesticks are essential in carrying out effective technical analysis which will inturn make us take the right decisions when it comes to trading
Thank you wi much for having taken your time to go through my publication. Greetings!