Getting Started with R - getting out of the command line and into an IDE - Thinking about tutorials and utopian
So since I didn't get a post out yesterday I wanted to start early today. I continue to move inexorably through the datacamp R tutorials, and am approaching the day when I may even be able to do something interesting with data! I am also hanging around the utopian discord, looking for any and all chances to learn something, and yesterday had such a chance! There was a half hour contest in which I had two entries accepted, and I was even encouraged to work towards producing some R tutorials on utopian!
This seems like a wonderful intermediate goal for me with R, as I learn I can turn certain aspects into freely available tutorials, compounding my learning and enhancing the information for the whole community!
Last night I even got a little burnt out on the data camp curriculum, but I came to the realization that a lot of the 'basic programming' concepts are very similar no matter what language you are working with. This is the first time I have had that feeling, so I must be making personal progress, right?
What I mean is that after doing comparisons, if statements, loops and functions in R, I realized how similar it is to doing the very same things in Javascript, and Python, and in Visual Basic before that.
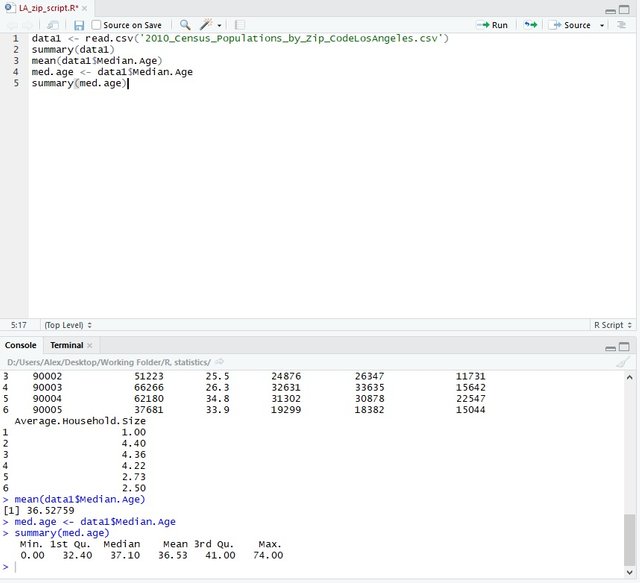
You may have noticed in my previous articles that I was typing directly into the raw R console. This means that all of the commands I type were executed, but none of them were saved. Inside this development environment RStudio, there is a text editor where I can now write and save R code as scripts, and choose which pieces to run in the console.
Above, you can see that I am beginning a script dealing with the Los Angeles County zip code data. Saving my script means never having to type read.csv command to import the file again. In this way, scripts begin to save us time by automating repeated tasks.
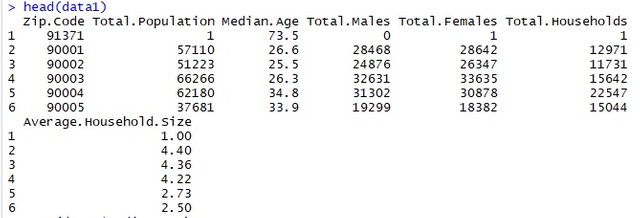
The great thing about this type of learning is that when the online 'class room' gets too boring, I can wander off on my own and try things out. Looking at the data I have available above, I try to think of what I could plot along with median age. The only one that makes sense to me is household size. Does household size get larger or smaller with an increase in median age?
Let's plot it out with the basic plot function!
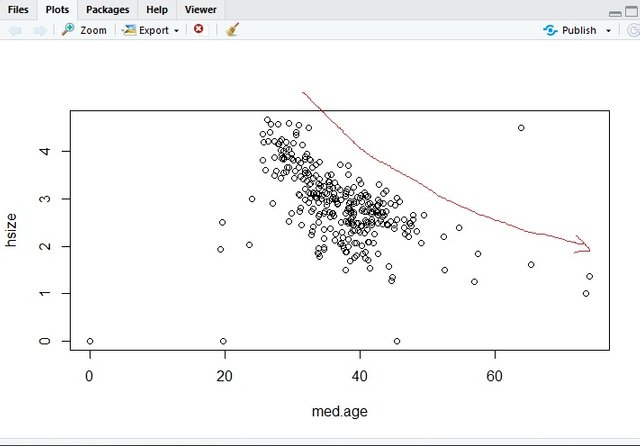
As you can see, above a certain age it does appear (at least in Los Angeles county) that an older average population is correlated to a lower average household size. I suspect this makes intuitive sense since as we grow older our children move out and on their own, and if we have the money to live in LA county we probably aren't getting any roommates XD. (Actually I am not sure if roommates count as part of household size since this 'household' definition may be the one used on taxes...)
Finally a graph that has some meaning! It's all up from here (or down in this case), but definitely we are heading in a direction!

Thanks for putting up with my ramblings, I have some ideas about putting this R stuff to good use and will continue working at it. I also have coffeesource.net mounted locally, so I can, for example, make you a nice table of contents of my previous R articles:
Getting Started with R - Baby's first steps at modern computer aided statistical analysis - How to maintain excitement while learning online
Getting Started with R - Things are heating up with government data! - defining variables from dataframes
I am still looking for support to host this baby, I have some leads but as has happened before in my life I sometimes confuse people more than I clarify. I have a ton more features to build out on this already useful app, and will be working to put it up as an official utopian project very soon.

Love to all!
I've been meaning to look at R for a while... although I've settled on getting my head around Tableau first of all....
I love data vizes.
Posted using Partiko Android
Alright! Yeah I have used power bi and a tiny little bit of tableau, data viz is powerful stuff!
The reason we avoided tableau (super powerful) at my last job is that all the clients needed an account to see the output. Consider carefully who you will want to see your work, because tableau is going to want money from them too.
Oh ok that's interesting to know about Tableau. I thought you could just save the analysis in different formats
Posted using Partiko Android
I am remembering now, so this is not infallible info, but I think its the interactive dashboards that you create apply to what I said.
Probably regular charts and graphs could be exported.
I'm far from being an expert at using it - really just for my own interest. Doing an online udemy course with Krill someone kr or other. It's really very good (ie NOT @joeparys) - this guy clearly is an expert, but he's yet to mention what you say here!
Doesn't surprise me tbh - software's all about the lock-in these days.
Is R open source? Im guessing it is.
Posted using Partiko Android
Yes! It is the open source one of the bunch, and so is a bit more disorganized with lots of optional packages and IDE's, but I am trying to invest the time and effort to get good enough at it.
I will be posting some silly shots like this, but hopefully will be doing some basic utopian tutorials for R and Rstudio and working my way up to some analysis posts.
Best of luck with it all. Utopian's one of the best things on here!
Posted using Partiko Android
This post has received a 3.13 % upvote from @drotto thanks to: @sbi-booster.
Congratulations @ecoinstant! You have completed the following achievement on the Steem blockchain and have been rewarded with new badge(s) :
Click on the badge to view your Board of Honor.
If you no longer want to receive notifications, reply to this comment with the word
STOPHi @ecoinstant!
Your post was upvoted by @steem-ua, new Steem dApp, using UserAuthority for algorithmic post curation!
Your UA account score is currently 4.173 which ranks you at #2801 across all Steem accounts.
Your rank has dropped 6 places in the last three days (old rank 2795).
In our last Algorithmic Curation Round, consisting of 441 contributions, your post is ranked at #142.
Evaluation of your UA score:
Feel free to join our @steem-ua Discord server