ARK: Short Term Correction Hasn't Changed the Longer Term Waves or Pattern

SUMMARY
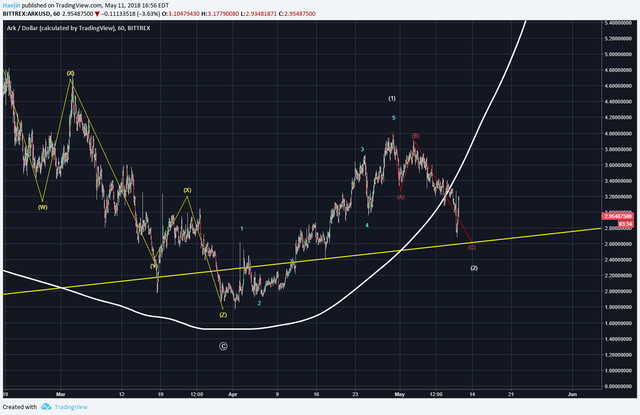
The short term count for ARK/USD shows that sicne the yellow Z wave of C bottom, five waves of an impulse have completed (blue). Elliott Waves states that after five waves, there is a correction. And that's what's been occuring as shown by the red ABC waves. Could price again temporarily pierce the lower yellow trend line? Yes and it'll still be a valid correction at around 0.78 Fib level.
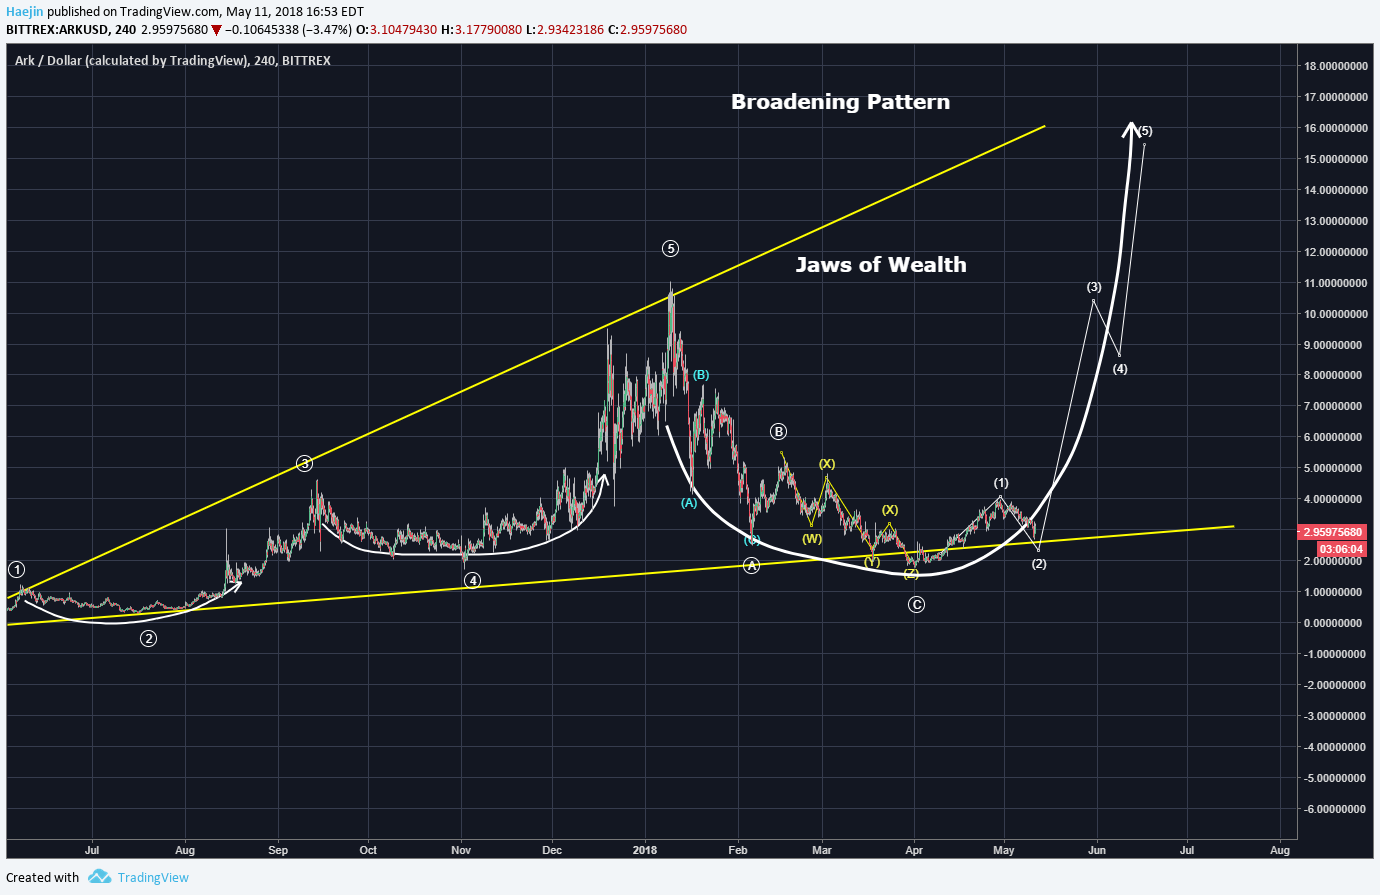
Even the longer term shows that wave 2 (white) is in progress as shown in the below chart. The broadening pattern is still intact. The key is to what depth will the retracement take? Probably 0.618 Fib level.
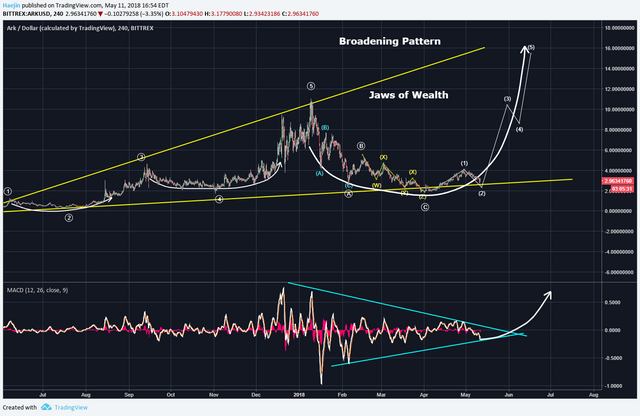
The MACD indicator hasn't really changed much and should soon turn up (white arrow).
Legal Disclaimer: I am not a financial advisor nor is any content in this article presented as financial advice. The information provided in this blog post and any other posts that I make and any accompanying material is for informational purposes only. It should not be considered financial or investment advice of any kind. One should consult with a financial or investment professional to determine what may be best for your individual needs. Plain English: This is only my opinion, make of it what you wish. What does this mean? It means it's not advice nor recommendation to either buy or sell anything! It's only meant for use as informative or entertainment purposes.
Please consider reviewing these Tutorials on:
Elliott Wave Counting Tutorial #1
Elliott Wave Counting Tutorial #2
Elliott Wave Counting Tutorial #3
Laddering and Buy/Sell Setups.
Laddering Example with EOS
Tutorial on the use of Fibonacci & Elliott Waves
@haejin's Trading Nuggets
Essay: Is Technical Analysis a Quantum Event?
Follow me on Twitter for Real Time Alerts!!
Follow me on StockTwits for UpDates!!
--
--


Ark also a huge sponsor for consensus 2018
Here is an image of Kim Jong Un taking a poo on @haejin the toilet!


This is called: The Jaws of Wealth!
Nice graphs! Focus on the long term not the short. Buy low sell high.
https://steemit.com/minnowsupportproject/@hashas120/discord-and-community-guide-to-the-msp-minnow-support-project
impressive. thank you
@haejin
Thank you
the curves and graphs looks confusing can you kindly trow more light to it please
thanks
Please help. https://steemit.com/cryptonews/@hashas120/korea-s-biggest-crypto-exchange-raided-over-suspected-fraud