Update On Bitcoin: Where's The Correction?
Bitcoin Daily
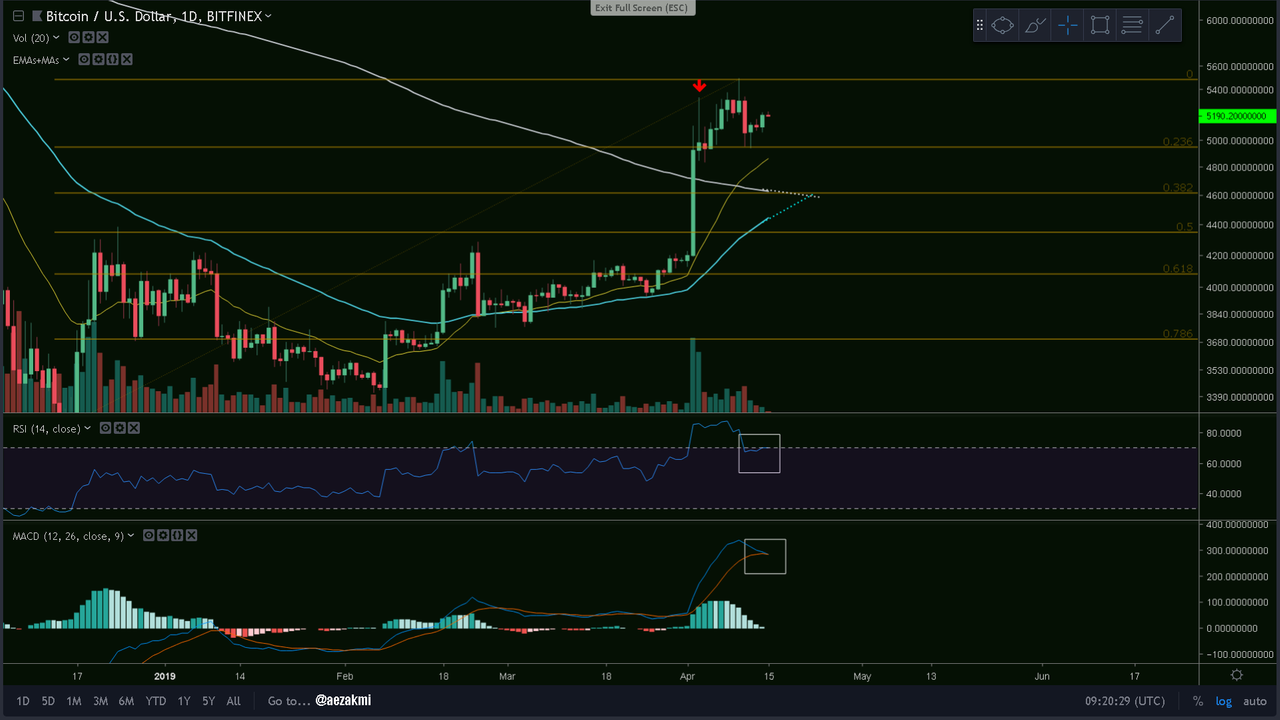
Bitcoin is still hovering above the 5000$ level and for now it doesn't seem to get any lower. The RSI is heading back in the overbought area and despite the recent bullish candles, the MACD indicates a bearish cross. There's still a high probability for us to retrace to the 0.382 Fibonacci level, which aligns with the junction of the 200 day MA (grey) and the 55 day MA (blue).
Ctrl + Click here to enlarge the image in a new tab (steemitimages)
Moving Averages
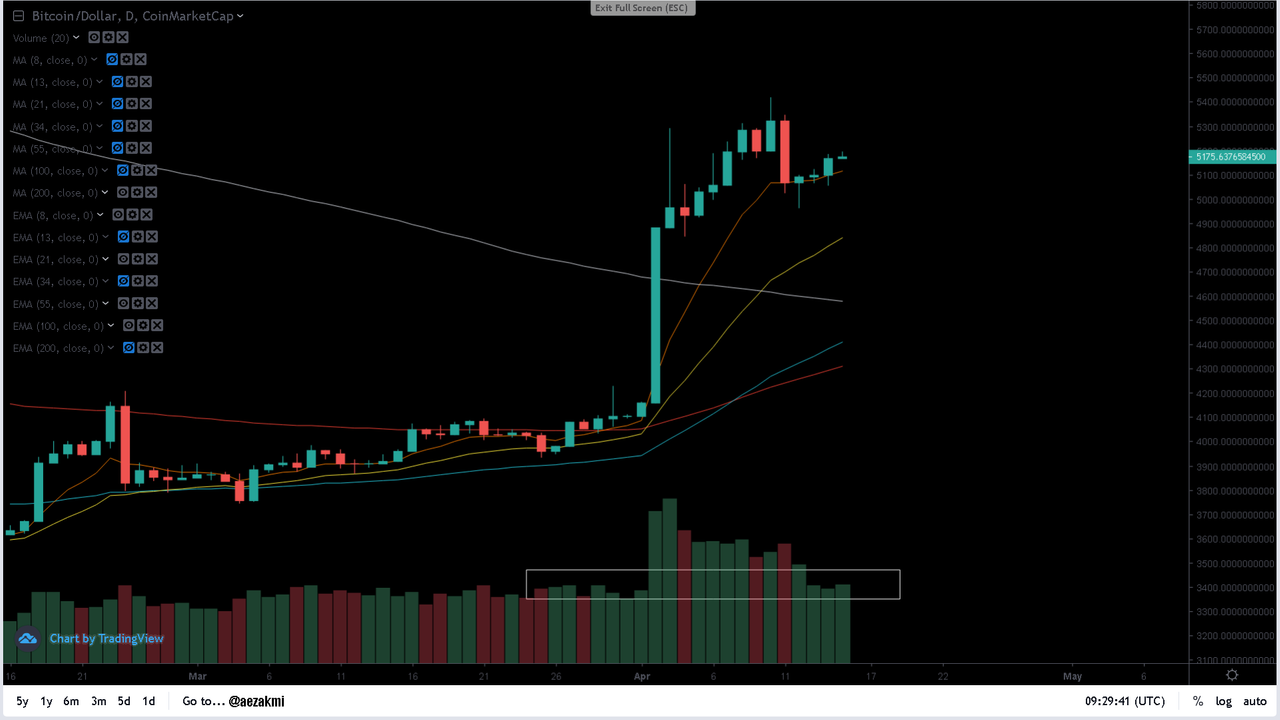
We're currently riding along with the 8 day EMA (brown), but I wouldn't count on its support, rather wait for the 21 EMA (yellow), which acted as support before. The trading Volume (calculated by Coinmarketcap) is back to the levels prior to the price spike.
Ctrl + Click here to enlarge the image in a new tab (steemitimages)
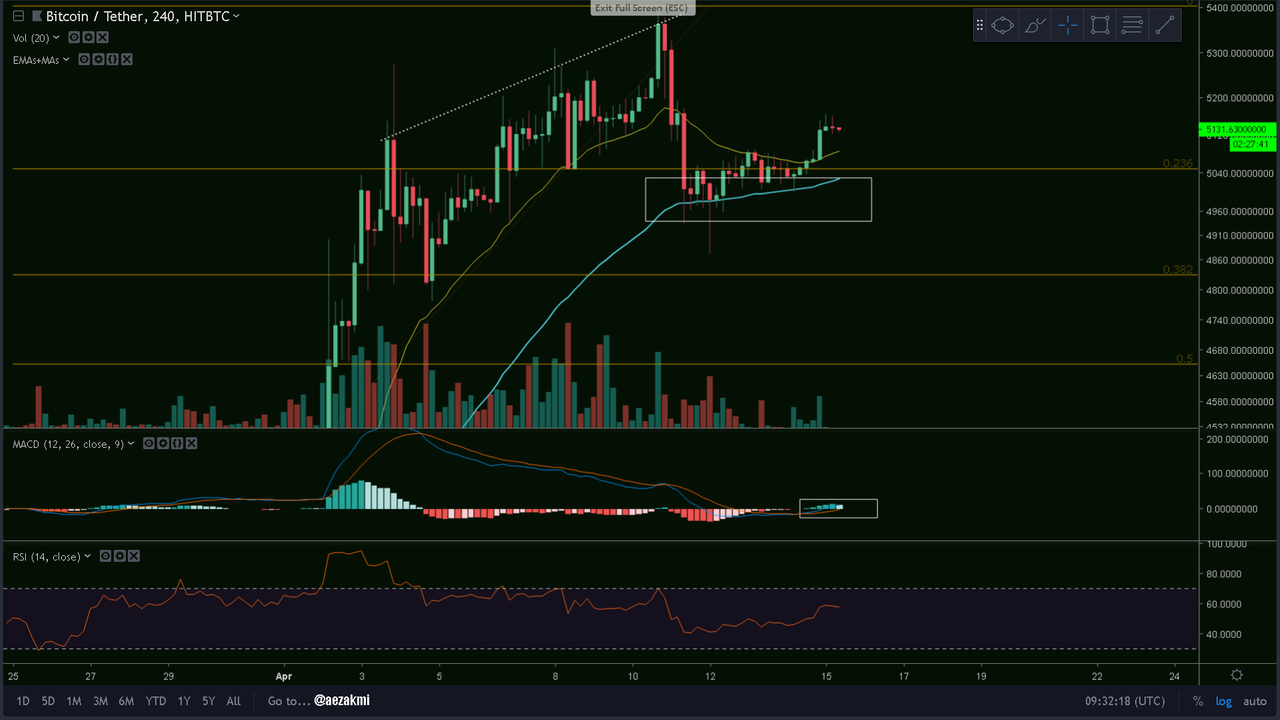
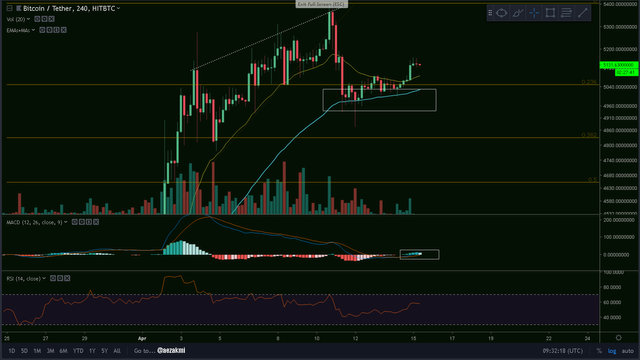
Closer Look - 4H Chart
As expected, we're back to the 55 EMA, which continues to support us. After a couple of rejections at the signal line, the MACD finally shows a bullish cross.
Ctrl + Click here to enlarge the image in a new tab (steemitimages)


Thanks for reading!

- My most used Exchanges:
- DRUGWARS - Play smart and earn STEEM!
Find me on Twitter for updates
STAY SAFE - TIP: ALWAYS CREATE A DIFFERENT PASSWORD FOR EACH EXCHANGE!NEVER USE THE SAME PASSWORD TWICE!SAVE THE PAGES TO YOUR BOOKMARKS, SO THAT YOU WON'T CLICK ON SCAM SITES!Thanks for reading and safe trading!✌
If you find this post useful, please:
