Weekly Bitcoin Chart Analysis - 1
Welcome to my first Bitcoin chart analysis on Steem!
Last week I thought the Bitcoin price had not yet reached its lowest point. Although the price eventually broke further down the bear-flag formation on Saturday and Sunday, the share price remained at the low of $ 6,119. My eyes were mainly focused on the $ 6,000 mark. A close below this level could, in my opinion, usher in a kind of second phase of the bear trend if the $ 6,000 then becomes a strong resistance. This of course has not happened (yet) and after good news about mass adoption and the rumor that JP Morgan wants to offer its customers Bitcoin return SWAP products, the price of Bitcoin rose to over $ 6500. Although Bitcoin's share price has risen over the past few days, the sentiment among traders also has changed rapidly to bullish. We are talking about the start of a new bull run after the $ 6,000 support level held for the 5th time and we have had so much good news, but unfortunately I do not share this optimism. Believe me when I say that I want a new bull run for everyone and that people who have suffered great losses in recent months will at least earn their money back and maybe make some profit. However, we must not forget that the current downward trend has not yet broken and that this rally also fits perfectly well in the downward trend. A break through the $ 6,000 support level is still a very real possibility.
The price only needed a day to recover slightly and the internet was full of positive reports. I understand: positive reports get, in this case, more attention than negative reports but when we look at Bitcoin's daily graph in Figure 1 it becomes clear that the bearish descending triangle is still in play. I am therefore waiting for a sustained break from this formation before my outlook becomes more positive in the short term.
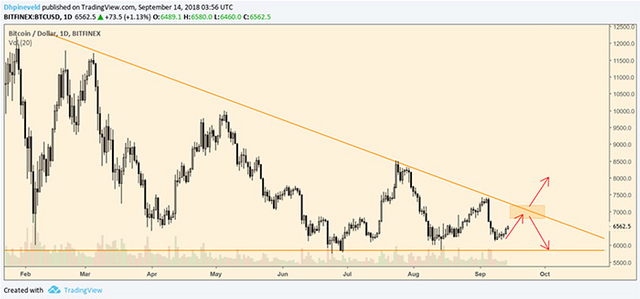
At the moment, Bitcoin's share price is rallying - albeit at low volume. However, as shown in the image above, the levels of $ 6,800 and then the $ 7,100 are the real points of interests. In that respect, virtually nothing has changed compared to my analysis of last week. Then I indicated that Bitcoin is, as it were, in a box zone and that my eyes were initially focused on the levels of $ 6,000 and $ 6,800, and in particular on $ 6,000. This is still the case, but as a result of the short rally I am now more focused on the level of $ 6,800 and then the $ 7,100 instead of the $ 6,000.
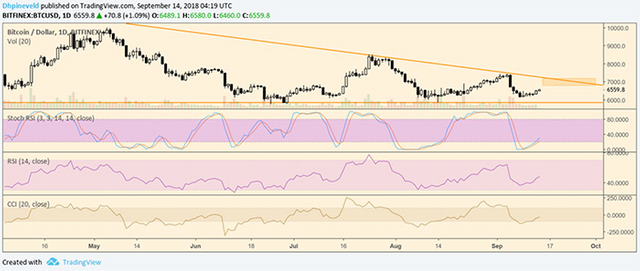
On the positive side: the previous correction stayed on $ 6,119 and this means that Bitcoin made a higher 'low'. This in itself is a very positive signal, but according to the current circumstances, it’s not enough. However, the momentum indicators on the daily graph also give a positive signal with sufficient room for at least a continuation of the current rally.
On the daily graph it all looks pretty positive, but when we zoom out and we take the weekly chart, it becomes clear that the current rally is hanging by a thread and that it is too soon to be excessively positive.
In the image above you can see how the new weekly candle is in stark contrast to the previous candle. In addition, the volume is only a fraction of that of last week. With regard to the volume, a side note is appropriate because it is not uncommon for a new longer trend to initially start at low volume. This is because the fear among the bulls is large and this often happens after 'capitulation' has taken place and for a short time all the trust from the market is gone.
There will be traders who therefore have little care for the current low volume, but I believe that we have not experienced real 'capitulation' yet. A break through the $ 6,000 and the formation of a new low would, in my view, be necessary to bring this about and lay the foundations for a new and sustainable rally. Anyway, that is only an opinion and certainly not a condition. As I indicated, my eyes are primarily focused on the level of $ 6,800 and then $ 7,100. A break by the $ 7,100 would validate the current descending triangle. However, if we break even through the $ 7,400 (the highlight of the previous rally), the picture for Bitcoin will be very positive. For the time being, it promises to be an interesting week.