Bitcoin is aimed at a breakthrough in a tapering trading range.
We present you the translation of the article on the Bitcoin analysis of the market from the analyst Omkar Godbole. In the article, he gives his forecast for the development of the situation on the crypto currency market : technical analysis shows that Bitcoin (BTC) is stuck in a narrow price range (about $ 550) between key long-term moving averages and can prepare for a breakthrough.
However, there remains one problem: is it necessary to find out in which direction the price will move, in the bull or bearish side?
At the time of writing, BTC trades at 8,760 dollars between the 50-day moving average (MA) (at $ 8,287) and the 100-day moving average (MA) at $ 8,837.
Sale of assets from the maximum on May 5 (9,990 dollars) stopped on Saturday about 50-day moving average (MA). In addition, the 50-day moving average (MA) also acted as a strong support level on Monday. Meanwhile, in both cases, the rebound from the 50-day moving average (MA) stopped around the resistance of the 100-day moving average (MA).
This dynamic observed over the past three days set the 50-day moving average (MA) as the key support level, and the 100-day moving average (MA) as a significant resistance, and a breakout from this zone is likely to set the tone the subsequent movement of the BTC.
Daily chart
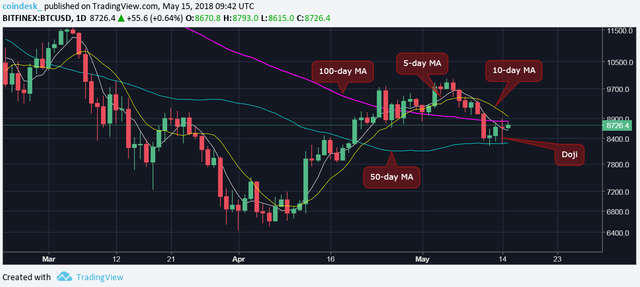
On Monday, the BTC formed a doji pattern - a candle that indicates the market's indecision. However, if you analyze the situation against the background of a sell-off from the May 5 high ($ 9,990), then the doji is more likely to signal indecision among the bears (or bearish depletion). Thus, the immediate bearish outlook was neutralized.
Today's close (UTC) above the 100-day moving average (MA) (at 8,837 dollars) will signal a bullish spread of the doji and an upward break in the narrow price range. Meanwhile, closing below the 50-day moving average (MA) (at $ 8,287) will confirm a downward break in this trading range and form a bearish continuation of the doji, i.e. The sale from the recent high of $ 9,990 will resume.
Nevertheless, the chances of a bullish breakout (or a bullish doji turn) still seem low, as the bulls face a difficult task, which is indicated in the graph below.
4 hours chart
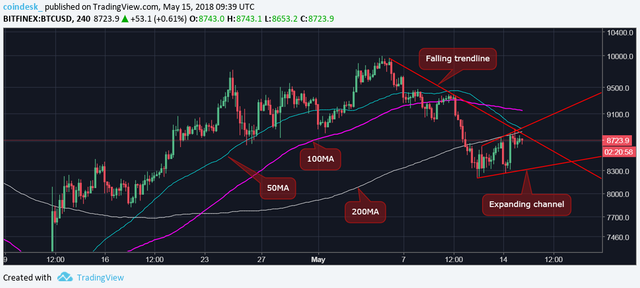
In the above chart, the resistance of the downtrend line is approximately at $ 8,810, followed immediately by another barrier, $ 8,910 (resistance of the expanding channel).
Taking into account the direction of the moving averages (50, 100-candle MAs) looking south (favoring bears), BTC bulls are likely to have to try to convincingly overcome the resistance at around $ 8,900.
Note that the bears are going to earn another point in their favor by pushing the 50-candle moving average (MA) below the 200-candle moving average (MA), completing the bearish crossover.
The 5-day moving average (MA) and the 10-day moving average (MA) (see daily chart) also favor the bears.
What to expect in the future?
A repeated failure near the descending line of the trend observed on the 4-hour chart is most likely to lead to a drop to the 50-day moving average (MA), located at $ 8,287.
However, only a daily close (in UTC) below the 50-day moving average (MA) will mean a revival of sales from recent highs to $ 9 990 and enable an even deeper drop to 7787 dollars (61.8% Fibonacci retracement from the rally from the April Friar minimum to a maximum on May 5) or even to $ 7,698 (61.8% of Fibonacci retracement from growth from the July low of 2015 to the December high of 2017).
On the other hand, a convincing move above $ 8,910 (an obstacle to the expanding channel) could lead to a move to the next resistance level of $ 9,390.