Bitcoin Movements Ahead on the Way to the Moon
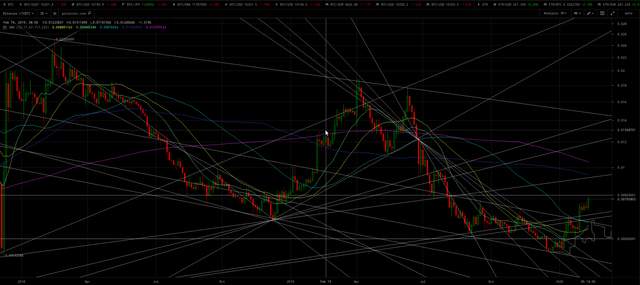
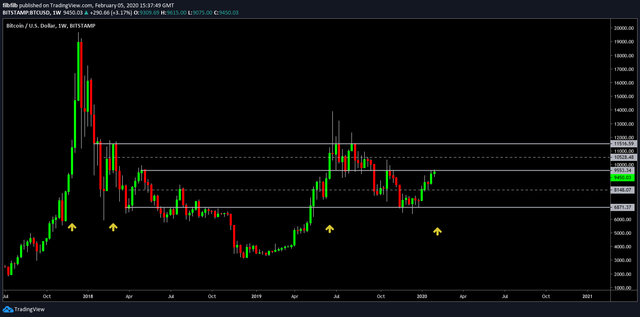
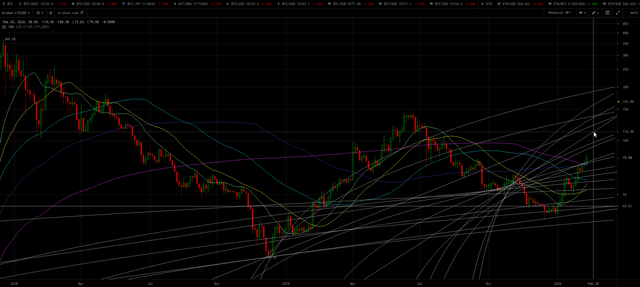
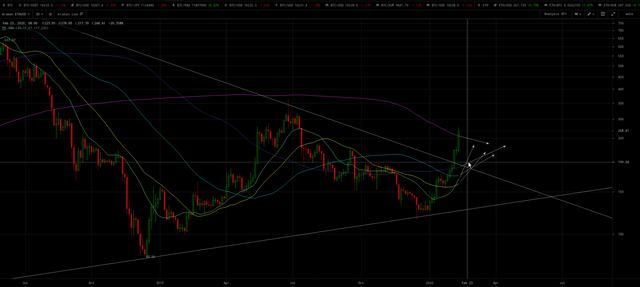
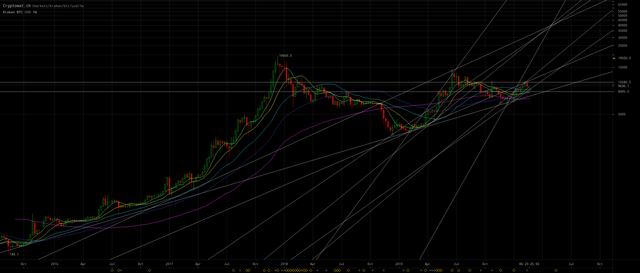
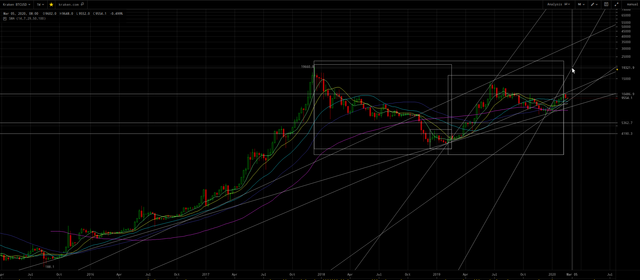
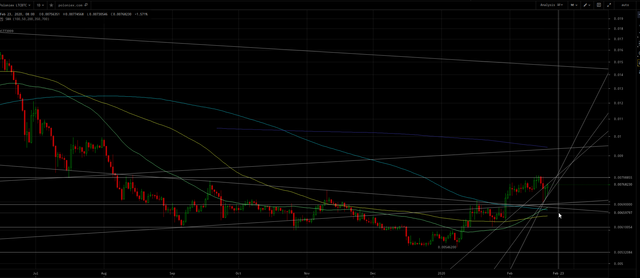
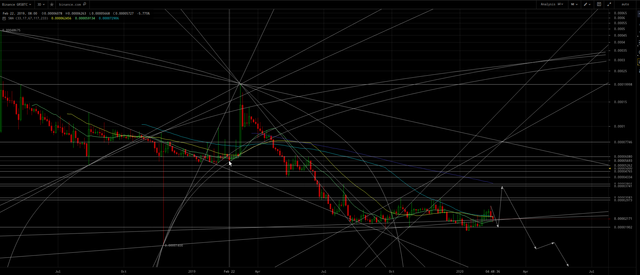
Appears Bitcoin is moving back up to the top of a massive bull flag wedge which originated at the peak at the end of 2017:
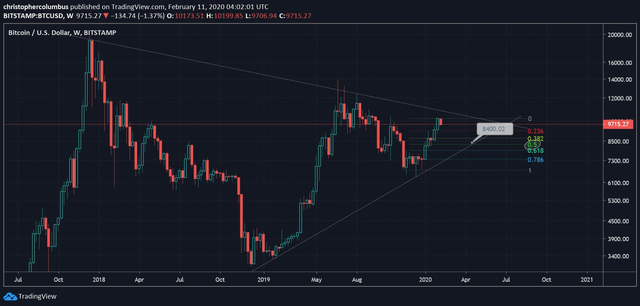
Analyst Who Predicted $6.4k Bitcoin Bottom: Price Will Hit $11k Before Pullback
That wedge bull flag is projecting a price rise to between $28,444 to $74,960!
Nick Chong tweeted:
“Real” Bitcoin golden crosses led to rallies of 20,500%, 6,750%, and 150%.
If history rhymes, BTC could do extremely well in the coming years.
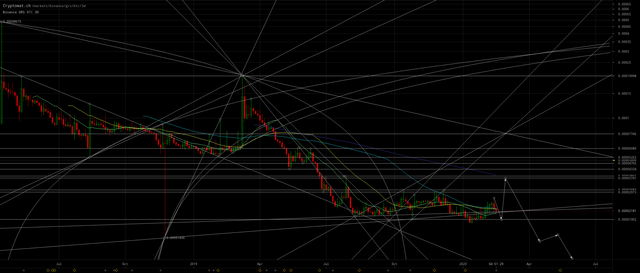
Here’s my charts updated with recent price action. I originally posted these charts 29 days ago. Note how the Bitcoin price has been nearly precisely tracking the price line I had drawn on these charts 29 days ago!
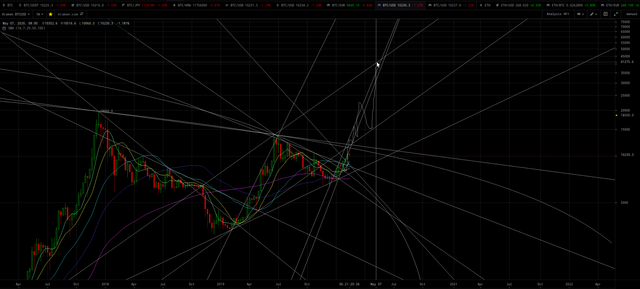
(click to zoom)
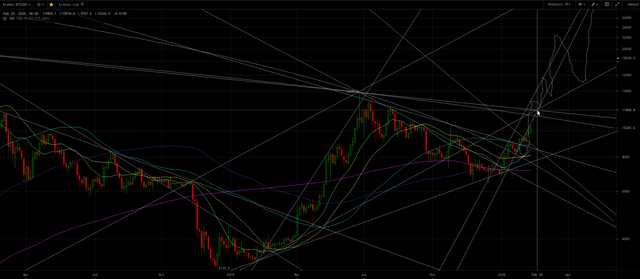
(click to zoom)
So the top of the bearish wedge which may act initially as resistance could be reached between ~$11,400 to $11,900 perhaps by February 17 to 20.
Also there’s a rising, bearish wedge on the Bitcoin chart, which portends a peak and correction is near.
Note as always on my logarithmically-scaled charts, the curved lines are straight on the linearly-scaled price axis (or vice versa if I’m displaying the linearly-scaled chart).
As of today Bitcoin achieved the price prediction I emailed (and then later posted) 2 weeks ago:
Litecoin will within days likely make a lurch upward to
0.0085BTC to~$90as BTC moves to~$10.5k.
As of writing this, there’s a slight pullback to the $10,100 level, perhaps before lurching higher to the said targets, but…
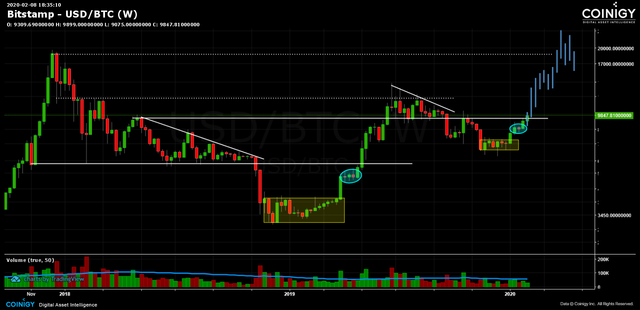
Note @masterluc — who amazingly correctly predicted the December 2019 ~$6k low a year or more before it occurred — has often failed with his shorter-term predictions. And his recent updates appears it will be another incorrect prediction because in my opinion/analysis he has drawn the bottom of the wedge too low (by not intersecting the December 2018 $3k low, which is marked “a” on his chart):
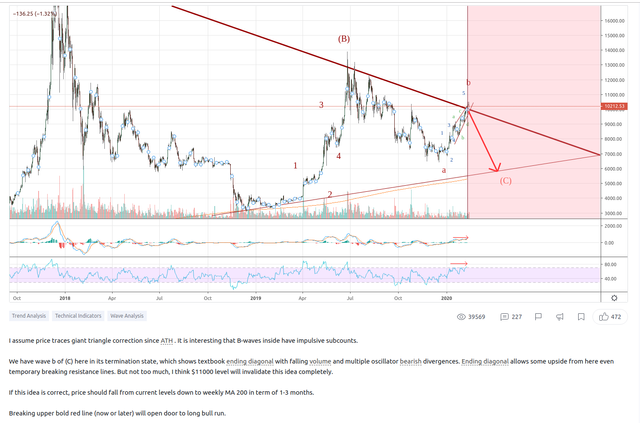
(click to zoom and read)
I’m surprised he would (intentionally? deep state propagandist?) make that mistake because the line which correctly intersects the $3k low has intersections with the lows going back several years and is a line that I think he has himself noted in the past. That’s one of the reasons why I’m confident he drew it incorrectly.
Note @masterluc admits a move to above $11k will invalidate his thesis cited above. And he has a reasonable point that the overhead resistance for the top of the bullish wedge can be drawn lower than $11.5k or even lower than $11k.
And I can find evidence that @masterluc’s thesis for a correction may be correct — excepting as already stated in my opinion/analysis he drew the bottom of the wedge incorrectly and thus he exaggerates the severity of his posited correction and the duration for a potential move to the bottom of the wedge.
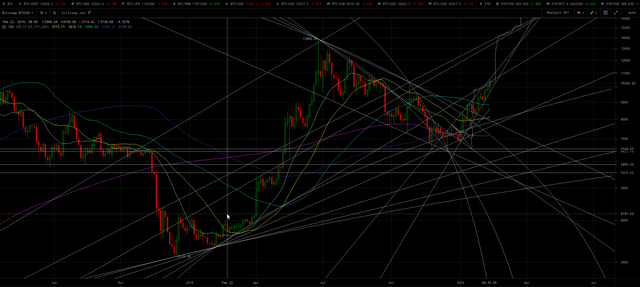
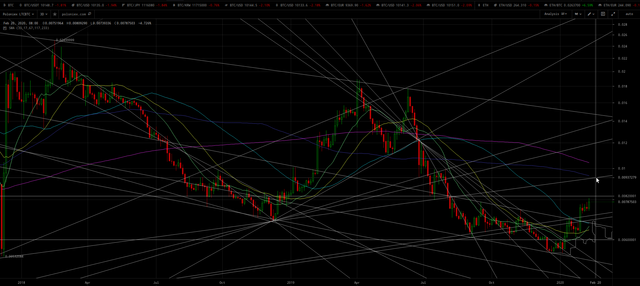
The LTC/BTC ratio chart is indicating that the current juncture is a potentially a repeating fractal pattern that corresponds to February 22, 2019:
(click to zoom)
In that case, Bitcoin may be poised to decline back to the correctly drawn wedge bottom as it did in March 2019 perhaps before rising above $11k. Note on the Bitstamp chart below there is also a repeating double-top pattern in 2019 and 2020:
(click to zoom)
Note the annotated rising, bearish wedge on the Bitcoin chart above, which portends a peak and correction is near.
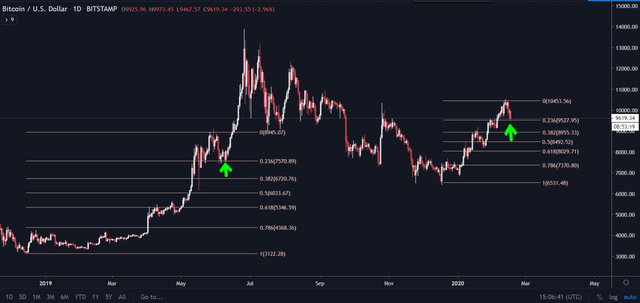
After writing the above, I read that this posited double-top has been noted by another analyst in Top Analyst: BTC’s Current Resistance Could Spark a Move to $7,800 :
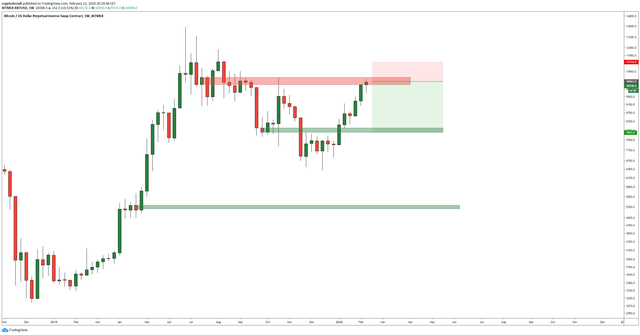
Yet in terms of overall timing of the cup and handle pattern, the current juncture also corresponds to April/May 2019, which is important for considering the duration of any dip back to the bottom of said bullish wedge. The current cup seems to be ~75% of the duration of the prior 2019 cup.
Roughly looks like after peaking $10.5k to $11.5k then a decline into late February or start of March to between $8.4k to $8.8k at roughly the 100 or 200 DMA, although bear in mind the confluence $9,550 zone mentioned below — which might serve as support on the downside.
And the ~1.25X vertical acceleration of this cup compared to the one in 2019, is portending a spike to between $13.8k and $15.3k probably in early to mid-March.
The repeating fractal pattern portends another spike to ~$22k later in April. And then in the middle of May a blow-off peak of ~$35k although the spikes could be progressively higher because acceleration is a non-linear projection.
(click to zoom)
$9,550 Market Inflection Zone
Filb Filb — who alike @masterluc also predicted both the aforementioned $3k and $6k lows — also projects ~$11,500 to $11,700 based on market inflection zones with $9,550 being a critical price level for a catapult higher (and possibly as support for my posited flash crash scenario to below $9k and note also the severe flash crash in April 2019 which was due to some exchange hack if I remember correctly).
Bitcoin Preparing For 15% Jump From Here: Here’s Why
Even others are finally starting to note the fractal pattern (as it unfolds that) I’ve been presciently blogging for many months (before it happened!):
Others Expect Upside Too
Fractal: Bitcoin May Soon Go Near-Vertical, Ripping Past $10,000
Except the charts above correlate the current juncture to April 2019 instead of my posited correlation to February 2019.
I think they’re highly underestimating the extent of the parabolic move ahead. Another example is Eerie Accurate Analyst Thinks Bitcoin Will Hit $100,000 doesn’t expect a new ATM above $20k until 2021.
Haha, I told everyone in my blogs but I’m widely ignored, lol: Analysts Say Crypto Market Yet to Believe in Bull Run, Expect Further Gains:
Notable cryptocurrency observers claim that the Bitcoin market is still in disbelief at the current price rally. This, for them, is a sign that prices of crypto assets will head a lot higher during this market cycle.
C.f. also my other prior blogs:
- Legacy Bitcoin to radically outperform gold
- Bitcoin Preparing to Rocket Launch?
- Bitcoin’s Whiplash Bear Trap
- Bitcoin to $80,000 before May 2020 and $1 billion by December 2020?
- McAfee’s Dick Math: illuminating Bitcoin’s ACCELERATING price
- Precisely Why Bitcoin Is Re-accelerating
Altcoins
The altcoins appear to be headed for a peak price as priced in BTC (aka Bitcoin) probably in March[February, c.f. update sections below] when they hit the overhead resistance at the top of bullish wedges on their price charts (as priced in BTC). And price peaks as priced in USD to be before or by May.
I posit that any breakout from these bullish wedges (as priced in “BTC”) may occur after the May 14 Bitcoin halving event and would be due to the Bitcoin Core impostor (aka “BTC”) crashing in price (with altcoins also perhaps correcting downwards in USD price but less egregiously so thus their price in “BTC” rising). The legacy Bitcoin (i.e. not BSV) is posited to continue rising in price towards $100+k in 2020 then 1+ million. It’s difficult to imagine at this juncture in the cryptocosm for example Ethereum gaining 10X or 20X value as priced in BTC without BTC being attacked. So these massive bullish wedges on the altcoin charts as priced in “BTC” may be signaling some massive attack on the impostor Bitcoin. See below for supporting charts. Thus I posit the prices of these altcoins relative to the legacy Bitcoin — i.e. not “BTC” but the original BTC before Core fucked it up with a softfork — will fall out the bottom of said “bullish” wedges. Ironic. The wedges are bullish for the impostor Core “BTC” but bearish for legacy (i.e. Satoshi’s original protocol) BTC (which is not BSV).
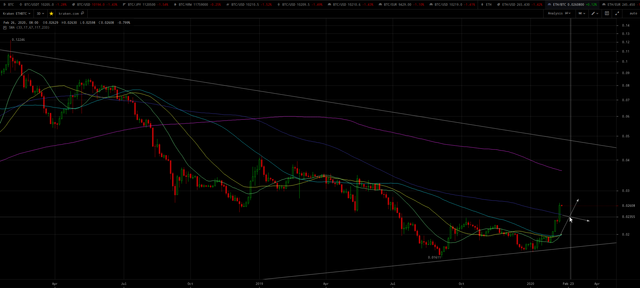
A case can be made for Litecoin to only rise to only between ~$85 and $98 thus LTC/BTC ratio to only between 0.0080 and 0.0082 on this posited rise of BTC to the top of said bullish flag wedge resistance (before a posited correction):
(click to zoom)
Another scenario would be ~$111 and 0.0093 near the purple 50 WMA:
(click to zoom)
(click to zoom)
But if there won’t be a surge much above $11k for Bitcoin, then the top for LTC/BTC may have already been reached at 0.08 until after a correction. In this scenario I could imagine a next spike (after or without any correction) to the very well defined overhead resistance line at ~$130 in early March[late February, c.f. update sections below] which would provide LTC/BTC of ~0.0093 at another well defined overhead resistance line (with a Bitcoin price of ~$13.9k).
Although a quick move to ~$110 (before or without any correction) on that same overhead resistance line with Bitcoin topping at ~$11k would yield a ~0.01 LTC/BTC near the magenta 100 WMA. In this scenario a correction back to said well defined overhead resistance line at ~0.0094+. That posited correction would correspond to perhaps ~$82 LTC (which also meets a rapidly rising 50 DMA) and ~$8800 BTC.
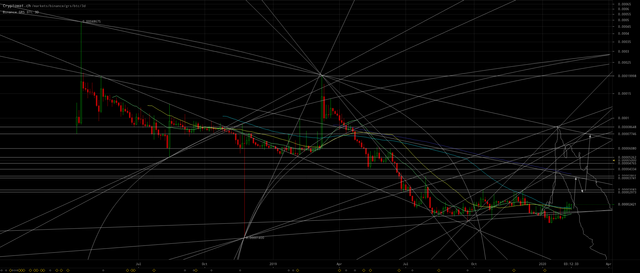
I reiterated recently that GRS/BTC appears poised to jump to 0.000035+ later in February as Bitcoin is correcting. Next decline back to perhaps ~0.000030. Then on the next spike of all in March, GRS/BTC could exceed [c.f. update sections below]:0.00007
(click to zoom)
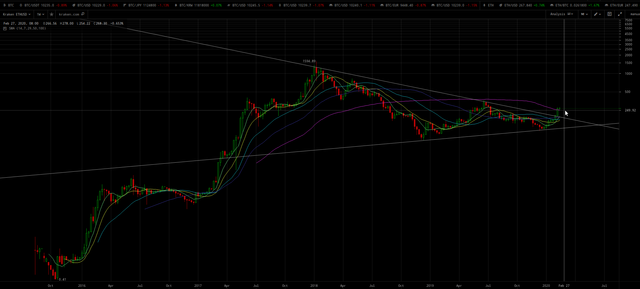
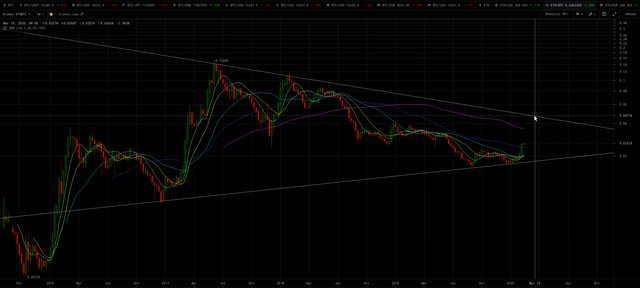
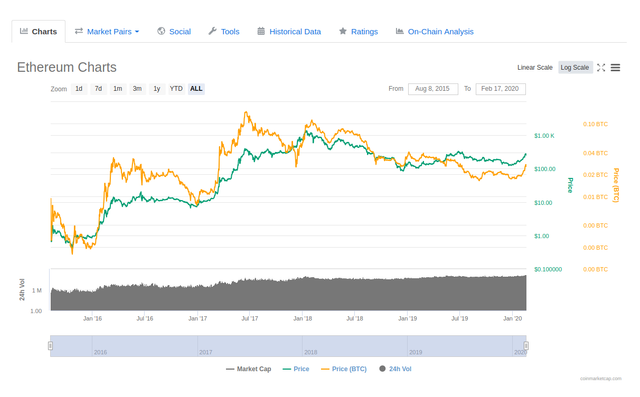
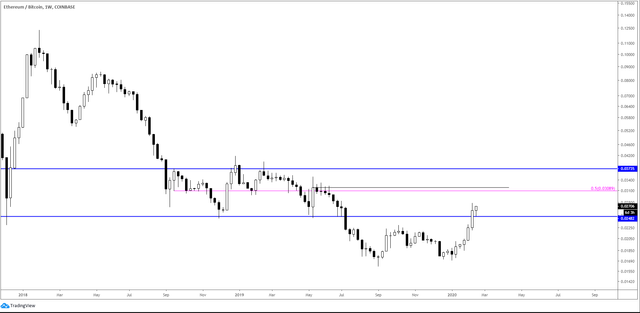
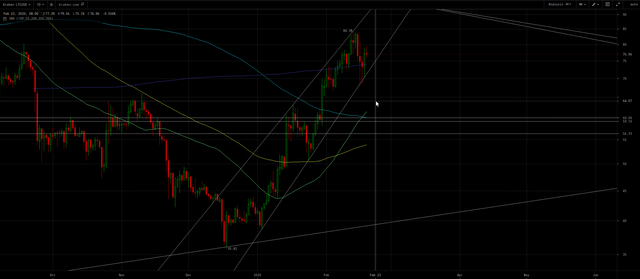
Ethereum (ETH/USD) has broken out above a massive bullish wedge which projects to between ~$850 to $1700:
(click to zoom)
(click to zoom)
Will ETH/BTC decline back to the purple 50 WMA at ~0.024 before rocketing to the magenta 100 WMA at ~0.036 (probably in February) and ultimately ~0.047 (probably in March)?
(click to zoom)
(click to zoom)
It’s plausible for a correction to the rapidly rising 50 DMA at ~0.028+ after a possibly quick rise to 0.036. That posited correction would correspond to perhaps ~$210 ETH (which also meets a rapidly rising 50 DMA) and ~$8800 BTC.
The ETH/BTC chart also has a long-term, bullish wedge which is projecting to between 0.3 and 0.8, probably after the May 14 Bitcoin halving event! That’s a 10X to 20X gain relative to “BTC”. Thus this seems to be confirming that the Bitcoin Core (aka “BTC”) which I posit to be the impostor Bitcoin, will be crashing in price after the May 14 event.
The analogous long-term, bullish wedge is less well-defined on LTC/BTC chart, and may have already failed to the downside.
Conclusion
Buy altcoins on this pause expecting a further surge before any correction of Bitcoin. Consider selling altcoins for Bitcoin if the stated targets are reached and wait to repurchase on any pullback. Note I don’t advise selling to USD because posited pullbacks may never occur.
If the correction to the bottom of the wedge for Bitcoin occurs now without a further surge to ~$11k, then grin and hodl, because altcoins are very likely headed to stated targets within a month.
I’m suggesting to trade (sell) altcoins for BTC when they reach the top of their wedges[stated targets in update secions below] as priced in BTC (probably in March) and then hodl Bitcoin until late April or early May. I recently summarized the options for what to with Bitcoin in May and thereafter presuming my posited SegWit donations attack on the Bitcoin Core impostor comes to fruition:
It’s impossible to obtain virgin mined BTC now. No pools will provide it and no mining farm we can deal with is significant enough to mine outside of a pool.
The only viable options (if the price is ~$40+k before the May 14 halving event and thus likely the SegWit attack will occur) include:
- Sell some BTC before May 14.
- Hodl some BTC in legacy addresses (e.g. those that begin with a
1instead of3orbc1) and hope for a window of time to sell after the SegWit attack has died done (blocks not so full with donations) and before the FATF has ruled that mining farms must freeze tainted lineage BTC. Note the posited attack may destroy most of the exchanges, so no assurance of being able to cash out at the $100+k prices expect for the legacy BTC after the imposter Core BTC is destroyed.- Invest in ASIC mining hardware and sell the hardware when BTC is priced at $100+k later in 2020. Note the mining hardware is much cheaper if purchased in and kept in China.
- Go for a leveraged margin long position on BTC and generate more BTC before selling in May. Note this incurs risk if posited price rises do not occur.
- Speculate on
BSVrising after the posited attack. I am not confident about this. Might be a trap.
I’ll add:
6. Trade BTC for ETH if latter has transitioned to proof-of-stake. Delays were intentional? Hmm. But ETH may not perform as well as legacy BTC (because proof-of-stake is captured by an oligarchy, Ethereum isn’t immutable, not the original, not going to be a global reserve currency asset, etc).
P.S. I’m back in the USA. Now residing in Texas.
UPDATE Feb 16, 2020
Just now setup my desktop computer in my new apartment in Texas, so I could see what happened to the cryptocurrency prices the past two days.
I had my bid (buy) prices set for LTC/BTC from 0.0075 down to 0.0073, for ETH/BTC from 0.026 down to 0.025, for GRS/BTC from 0.000024 down to 0.000023. So obviously all of those filled during my absence over the past two days as I expected. Remember I stated in my recent blog that on the BTC chart there was a bearish rising wedge and the price would drop out causing a flash crash on the altcoins. I expected BTC to test the bottom of the rising bearish wedge on Sunday Feb. 16.
The altcoins moved to my absolute bottom targets relative to BTC, because the BTC price fell out of the wedge without bouncing to $11k after declining to the $10k bottom of the wedge — i.e. $10.5k was the top thus far and the wedge appears to have already peaked. My bids were set a bit higher than the absolute possible bottoms because I wasn’t sure whether BTC would decline to $10k then bounce to $11k (before falling out of the bearish rising wedge) thus possibly taking the altcoins to the next level higher relative to BTC before falling out of the wedge. I’m okay without missing the absolute bottoms of this bullish correction on the altcoins by about 5 – 10%. At least I bought back the altcoins for less than the price I sold them in early February.
URGENT: probably better jump on those altcoins now. BTC will likely to decline to between $9k and $9.5k over this week, but the altcoins will then start to moon w.r.t. to BTC as they also did in March 2019. Then next sudden lurch/surge upwards for BTC will send the altcoins to nosebleed levels. That should be in March 2020 and the altcoins should be traded (sold) for BTC then.
Maximum possible downsides for BTC is into the low-to-mid $8000s, but during Feb – April 2019, BTC only declined to the green 50 DMA on my charts. Thus it appears $9k will probably be the lowest. As it becomes clear BTC is not headed below $9k, the altcoins will start mooning. The market has shifted to bullish with some apprehension. AS the apprehension turns to FOMO, then the mooning.
UPDATE Feb 17, 2020
Started writing the following later in the day on Feb 16, but am finishing and posting it on the morning of Feb. 17. Note I sold some of my LTC and ETH at break even on the bounce to 0.00754 and 0.0267 while I sort out my analyses as follows…
Updated Litecoin Analysis
Further careful study of the LTC/BTC chart reveals February 13, 2020 likely corresponded to the fractal pattern of second week of March 2019. The acceleration from the bottom is posited to be ~2.4X (i.e. 0.4X duration) and thus the price rise relative to the initial bounce off the bottom is also ~0.4X. Thus, projecting ~0.088 on February 20, 2020 as the peak LTC/BTC. We must sell/trade LTC into BTC at that 0.088 price! Possibly the peak can be up to a key overhead resistance line ~0.091 (c.f. chart below). Possibly a double-top on March 18, 2020 which will meet the overhead resistance of the (purple on my charts) 50 WMA.
Note the current correction could bottom as low as ~0.068, but the bottom is likely already be behind us at 0.070 because LTC/USD has likely bottomed on its bearish rising wedge (shown in section below) otherwise LTC/USD would fall out of the wedge.
Updated Groestlcoin Analysis
In light of this further insight into deceleration and fractal correlation, GRS/BTC will peak at an absolute maximum of ~0.000037 and the more likely peak is between ~0.000029 and 0.000030, although the leverage so far relative to LTC with the presumption of LTC/BTC rising to ~0.009 projects GRS/BTC 0.000038. However there’s a significant risk that GRS/BTC has already peaked, although it hasn’t yet made its higher leveraged gain relative to Litecoin as it did in 2019. And this correction could bottom as low as between ~0.000019 and 0.000020. Altcoin FOMO greater fool reservoirs are being depleted as these greater fools are wrecked (aka REKTD).
In hindsight, I regret repurchasing GRS because the liquidity, spreads, and risk/reward are horrendous with great difficulty in selecting an entry and exit price. Since exit prices are usually on a very short duration spike, they have to be chosen well in advance. I didn’t realize recently how much LTC/BTC had decelerated compared to 2019.
Updated Ethereum Analysis
ETH/BTC may have bottomed on this correction although a further decline to the purple 50 WMA ~0.024 seems plausible.
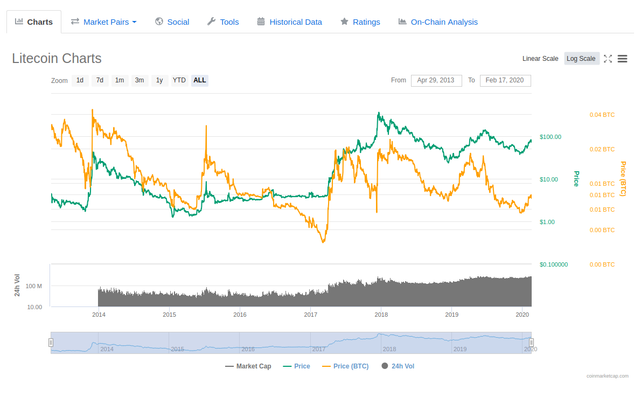
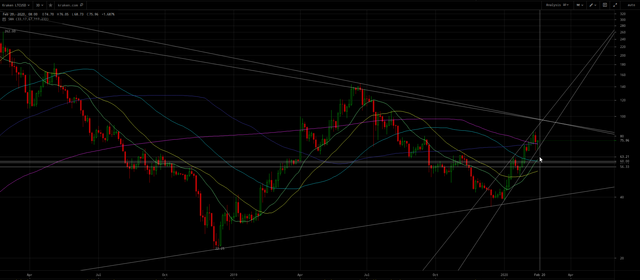
The long-term history of LTC/BTC exhibits lower lows and falling out the bottom of wedges, although LTC/USD is bullish:
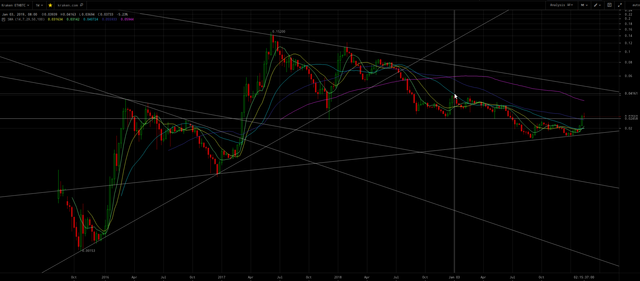
Whereas ETH/BTC exhibits higher highs and rising out of the top of wedges, and ETH/BTC is also bullish:
Note how twice before ETH/BTC corrected to just below its prior peak before rocketing up out of the bullish wedge to make a new high.
The following LTC/BTC chart helps to visualize the recent failed wedges, but also another key distinction from ETH/BTC occurred after January 3, 2019 as LTC/BTC subsequent outperformed ETH/BTC until April presumably because (delays for Ethereum’s promises to switch to proof-of-stake? and because) as stated ETH/BTC corrects to just below the prior peak before racing up to break up out of the bullish wedge:
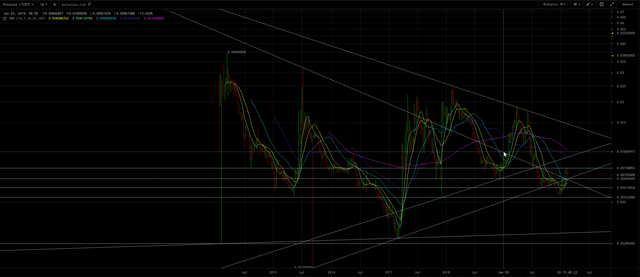
(click to zoom)
LTC/BTC is projected to peak at the purple 50 WMA (aka 350 DMA) and was repelled by a long-term horizontal confluence price level ~0.0081. Whereas, ETH/BTC has cleared the purple 50 WMA which is so far now acting as support on this correction:
(click to zoom)
Whereas from the bottom in December up to January 3, 2019 ETH/BTC was slightly outperforming LTC/BTC but then subsequently fell way behind. Currently ETH/BTC is slightly outpeforming LTC/BTC since the bottom January 8, 2020. And has outperformed so far until later in the posited fractal correlation pattern cycle than when it failed to keep up after January 3, 2019.
Another bullish sign of ETH/BTC’s relative acceleration compared to LTC/BTC is that the cyan 200 DMA has already curled up and been bullish crossed up over by the 100 DMA. Whereas for LTC/BTC the 200 DMA is still decline and the 100 DMA is still below the 200 DMA. Note also that ETH/BTC and LTC/BTC are out-of-phase because the former fell out of its wedge July/August 2018 and the latter fell out of its wedge August 2019. Both had a double-top at the top of their wedges before falling down out of their wedges.
ETH/BTC thus appears headed up to at least the magenta 100 WMA ~0.036 for the aforementioned posited coming peak in February.
Further confirmation comes from analyzing the differences in the LTC/USD and ETH/BTC charts. Note the ominous signal on the former that the declining magenta 100 WMA is bearishly crossing under the rising purple 50 WMA. The former is also in a short-term, bearish, narrowing rising wedge which appears will lurch to ~$90+ on February 20ish, which should provide the posited LTC/BTC of ~0.009 as BTC/USD declines to its green 50 DMA ~$9k:
(click to zoom)
Tangential Note: I’m now leaning to the scenario of this BTC/USD decline being only the handle of a cup and handle, so plausibly limited to a brief correction to $9k only. And if correct, then BTC/USD is preparing to break up out of the massive, bullish wedge shown in the topmost chart on this blog! ∎
After that, LTC/BTC should decline anew instead of breaking up out the long-term, bullish wedge. And LTC/USD will likely break out of its bullish wedge as BTC rockets, but within the said bearish wedge — ultimately falling out of the bearish wedge perhaps in April causing LTC/BTC to plummet.
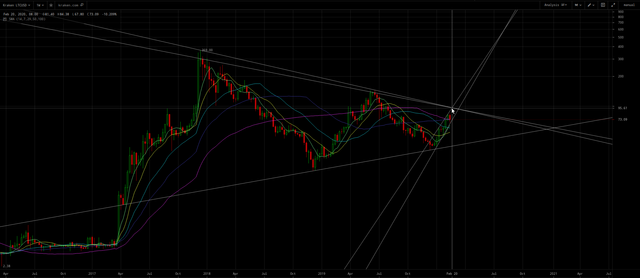
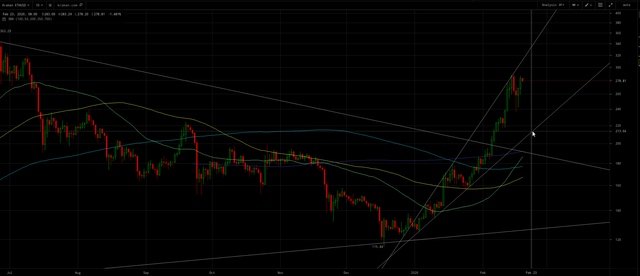
Whereas, ETH/USD has already broken up out of the long-term, bullish wedge and is also within a bullish, rising, broadening wedge:
(click to zoom)
But unlike LTC/BTC, ETD/USD has not likely bottomed yet for this correction, so a further decline of ETH/BTC to ~0.024 seems plausible. A surge up to the top of that broadening wedge February 20ish seems to the confirm the expectation of ETH/BTC ~0.035. By mid-March the top of the broadening wedge $600+ seems to confirm that ETH/BTC will reach the top of its long-term wedge ~0.048. If I’m correct about a $35+k BTC price by May, the upper line of the said broadening wedge (on ETH/USD) seems to confirm that ETH/BTC will hug the top of its long-term wedge until May down to ~0.043 before breaking up out as the posited crash of impostor Bitcoin Core (aka “BTC”) ensues.
IOW, take profits on ETH/BTC at 0.035 and 0.047 into legacy Bitcoin or other Segwit attack mitigation strategies mentioned in this blog.
Note the distinction between LTC and ETH appears to be ETH finally making concrete plans to switch to proof-of-stake, which will be immune to the barrage of attacks on proof-of-work altcoins coming after May 14. Whereas all proof-of-work altcoins except legacy Bitcoin (and especially those with the Segwit flaw such as Litecoin) will be toast after any Segwit attack posited to start May 14, 2020.
Yet the even for ETH/BTC, the magenta declining 100 WMA will bearishly cross under the purple 50 WMA before the May 14, 2020 halving event.
My interpretation of the altcoin charts seems to be confirming my posited Segwit attack scenario. Confirmation bias?
UPDATE Feb 18, 2020
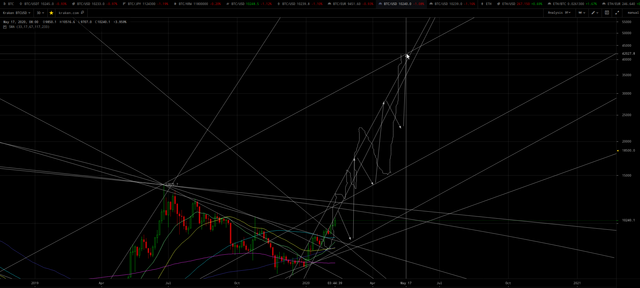
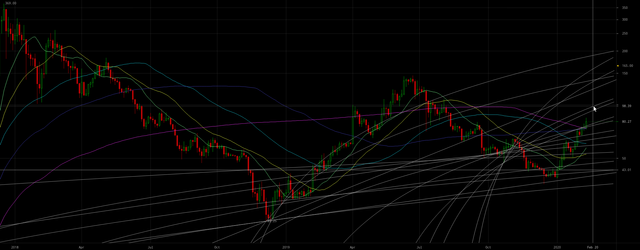
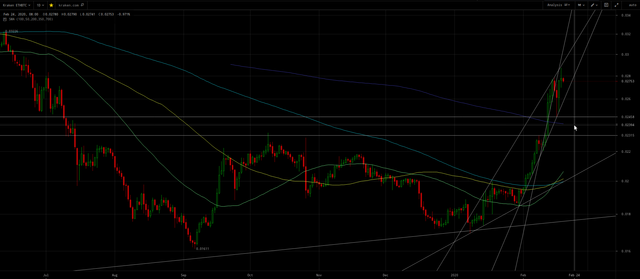
Keep the big picture of the repeating fractal pattern and incredible bullishness of Bitcoin in mind:
(click to zoom)
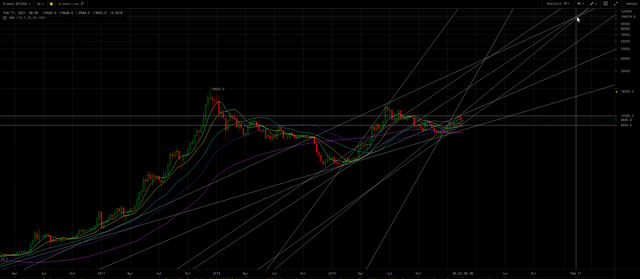
Here’s a copy of the above chart with selected price points displayed (if zoomed of course) for annotated lines to help you understand which annotated lines correspond to the analyses below:
(click to zoom)
(Tangentially on above chart note the golden cross of purple 50 up over the magenta 100 WMA, which instead was death cross under in 2019!)
Here’s the 3D (three day) version of above chart:
(click to zoom)
The annotated horizontal lines point out the fractal correspondence between the current cup & handle pattern with the one in 2019 which led to the $13.9k peak. Note how the cup comes up to the peak prior to the cup before forming the handle.
After the handle (correction), there’s a blow-off, parabolic move to another peak before a new decline and cup & handle ensues. Consecutive fractal patterns are become smaller and more accelerated, but these affine relationships also exist within larger scale self-similarity as can also be seen by zooming in/out on Mandelbrot sets.
So the difficult part which requires a high visual mathematical IQ, is that the current peak and correction — which forms the handle of the cup at the scale in which this current juncture corresponds to May 2019 — also corresponds to both peaks in February and April 2019 at other scales of the self-similar fractal pattern. Think of a Matryoshka doll:


(click to zoom)

Self-similarity - Wikipedia
So fractal pattern correspondence of the current juncture to late June 2019 $13.9k top (which forms the ongoing handle correction for the larger fractal pattern correspondence) is 3X to 5X accelerated, i.e. 0.33 (⅓) to 0.2 (⅕) of duration. Thus we can expect this correction to be between 0.33 × 0.33 = 0.11 to 0.2 × 0.2 = 0.04 the duration of the ~7 months correction in 2019 from the $13.9k peak to the $6.5k bottom. Thus 1 to 4 weeks for this current handle correction, which began on February 17.
Since this current juncture handle correction also has correspondence to either February 2019 (per the LTC/BTC pattern correspondence mentioned in this blog) or April 2019 (per the bullish, golden crosses of green 50 to yellow 100 and cyan 200 DMA) on the larger (broader) scale fractal pattern, thus a decline to or slightly below the 50 DMA is likely.
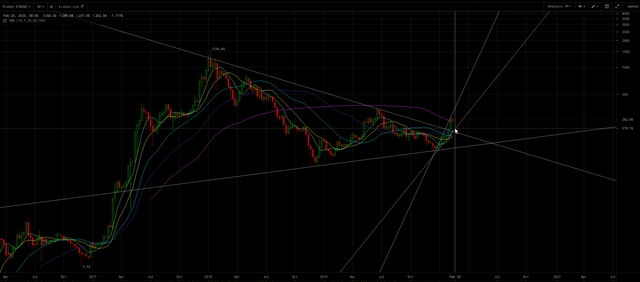
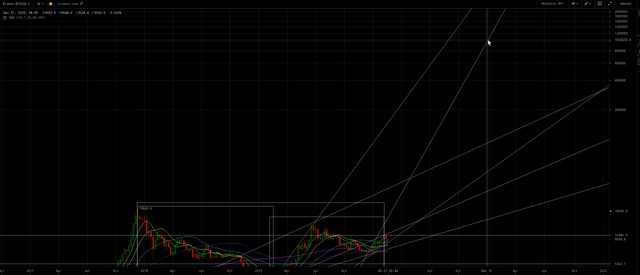
Note for my annotated trend lines on the first chart above that the prior $13.9k peak occurred at the junction of the — long-term trend line from the kickoff of the bullish move to the $19.7k peak prior to the $13.9k peak — and the trend line from the kickoff of the bullish move to the said $13.9k peak. And the corresponding ~$40k junction April 30, 2020 of the — trend line from the kickoff of the bullish move to the $13.9k peak prior to the current juncture coming peak — and the trend line from the kickoff of the bullish move to the current juncture coming peak!
That ~$40+k peak just before the May 14, 2020 Bitcoin mining reward halving event, it strongly suggestive of my posited Segwit donations attack on the impostor Bitcoin Core.
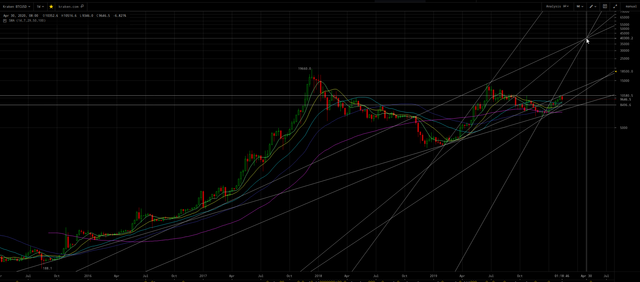
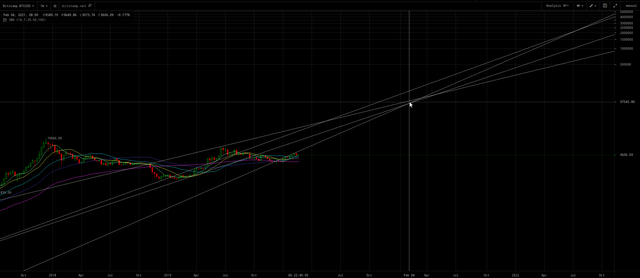
I added two trend lines to the following chart as compared to the first chart above, one which intersected at a confluence junction which predicted the $13.9k peak as shown (Bitstamp exchange):
(CLICK TO ZOOM)
The other added trend line is parallel to the trend line it would need to intersection to predict a peak price after $40k by April 30. This projects the next peak price after the May 14, 2020 halving event is infinite U.S. dollars! This seems to confirm the posited Segwit attack valuation model.
Here are the four pertinent trend lines for easier visualization (Kraken exchange):
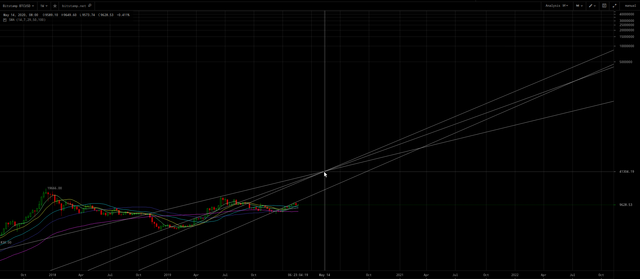
(CLICK TO ZOOM)
IOW, Bitcoin eventually becomes the new world reserve currency asset and U.S. dollar dies, as I have predicted in many of my blogs such as:
- Get Ready for a World Currency
- Bitcoin rises because land is becoming worthless
- Facebook’s Libra + Bitcoin + Trump + Israel = 666 Orwellian Dystopia
- Phoenix rises in 2020; all altcoins (including Bitcoin Core) will be 50+% attacked/destroyed
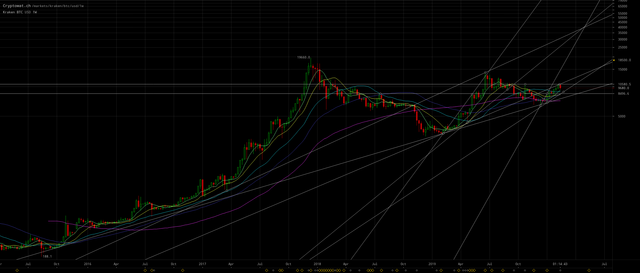
Note if I draw one of the trend lines in another position, there’s seems to be a ~$100k confluence junction February 2021, which I interpret to apply perhaps to Craig Wright’s BSV or to recovery of the posited impostor Bitcoin Core after Core is forced to hardfork (aka hardfuck) it to lower the difficulty so blocks can be mined every 10 minutes instead of once a month or so (although I think the Core chain will be continually 50+% attacked after the Segwit donations attack siphons away all the miners to legacy):
(CLICK TO ZOOM)
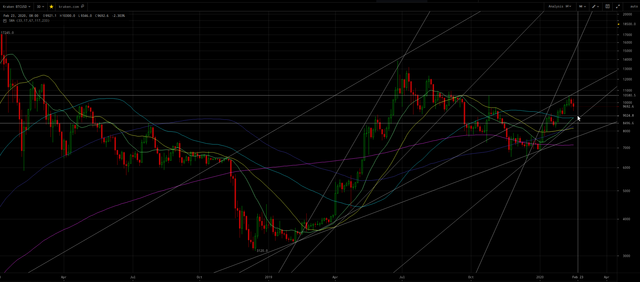
The self-similarity (two rightmost boxes and separately two leftmost boxes) fractal pattern depicted below also crudely (because non-linear, affine projection) linearly projects congruently 38 days × 24 months ÷ 14 months = 65 days + Feb. 17, 2020 =Apr. 22, 2020 and ($10.5k − 6.4k = $4.1k ÷ 6.4k = 0.64) ÷ ($4190 − 3330 = $860 ÷ 3330 = 0.26) = 2.5 × ($5.5k - 4.2k = $1.3k ÷ 4.2k = 0.31) × $10.5 = $8.1k + $10.5 =$18.6k:
(CLICK TO ZOOM)
As marked with the mouse on the above chart, I expect that $15+k price in March due to the acceleration of cumulative fractal patterns combined.
Legacy Bitcoin can plausibly attain a $1 million price in 2020, posited to be due to the stock-to-flows valuation model and the acceleration of feeding miners ~100+ Segwit donated BTC per mined block:
(click to zoom)
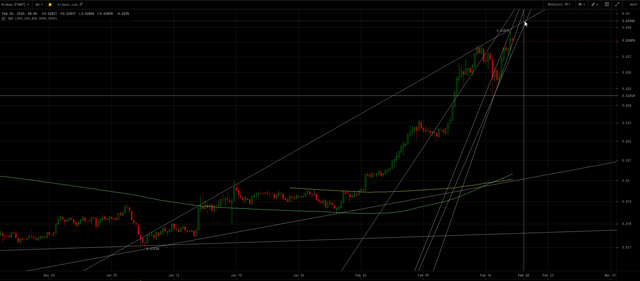
Bitcoin Handle Correction
BTC/USD is rallying up to the resistance of the bottom of the bearish, rising wedge it fell out of and also to the overhead resistance which was the support line from the start of the bull market on February 7, 2019:
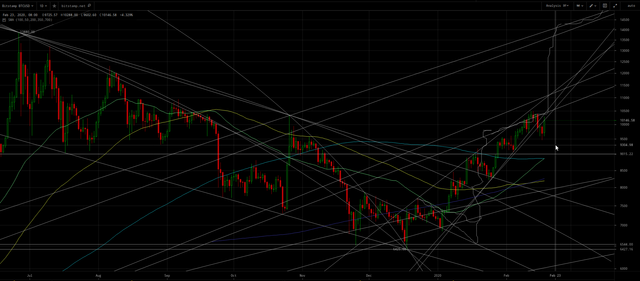
(click to zoom)
I’m anticipating another decline after bouncing to ~$10.5k, to a lower low between the strong horizontal confluence zone at $9kand the 50 DMA at ~$9300 no later than February 24.
Markets move in the direction that takes the most money from the most people. The recent shift of some to a more bullish posture and the FOMO fervor that’s starting to brew for example for ETH, probably requires a significant spike low to trigger many stop-losses to gain the base-camp fuel to propel much higher.
Filb filb (and a trader going by ‘George’) concur with the timing of this possibility (although last I checked he leans bullish):
George further explained “Keep it simple, $11,700 is next. Invalidation [if there is a] clean break below $9,500.”
Also, Filb Filb wrote that “every time Bitcoin turns $9,500 to support [on a weekly basis], it goes to $11,500.”
Unfortunately, right now it isn’t clear if Bitcoin will hold $9,500.
Note that the correction started on February 17, so the week will end February 24 although chart weekly may end as of the start of Saturday February 23.
Altcoins
Ethereum
Our first hint as to whether the altcoins will also decline with the posited coming decline of BTC, comes from zooming in on the aforementioned bullish, broadening, rising wedge on the 1H (one hour) ETC/ USD chart:
(click to zoom)
ETH/USD is struggling to return back to the overhead resistance at the top of said wedge. And appears to be in a reactionary, deadcat bounce on the way to a further decline to the bottom of said wedge (but not to fall out of the bottom of the bullish wedge). Positing a BTC/USD decline below $9500 by February 23 corresponding to ~$214 at bottom of said ETH/BTC wedge.
Yet unless BTC simultaneously dropped to $8700 the strong horizontal confluence for ETH/BTC at 0.0246 would fail as support, which might trigger some stop-loss selling:
(click to zoom and read tweet responses)
(click to zoom)
Which with BTC/USD between $9000 and $9300 would drop ETH/BTC towards the more recent horizontal confluence at ~0.0231 and the purple 50 WMA which will be below 0.024 by end of February 23:
(click to zoom)
Whereas, if ETH/USD were instead to rocket up to the top of the wedge with BTC/USD flat to slight decline, then ETH/BTC could hit the 0.035 target, although this would likely push out the timing to early March due to an overhead resistance trend line:
(click to zoom)
Litecoin
Furthermore LTC/BTC is in a short-term, bearish, rising, narrowing wedge which portends a drop to between 0.0065 and 0.0070:
(click to zoom)
(click to zoom)
And LTC/USD may drop out the bottom of its bearish, rising, narrowing wedge to a price between horizontal confluence at$56 up to $63 for the projected green 50 DMA (with these posited values congruent with the posited values above for LTC/BTC given the posited values above for BTC/USD):
(click to zoom)
(click to zoom)
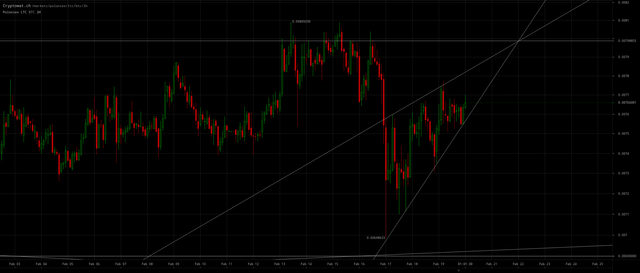
Groestlcoin
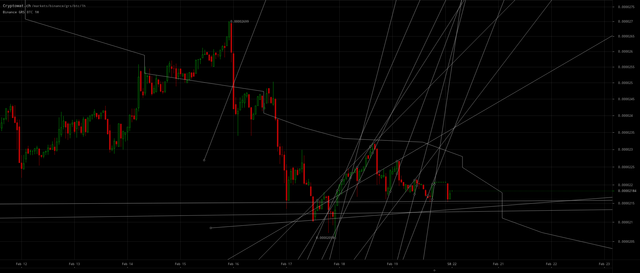
Likewise GRS/BTC is tumbling down in consecutive bearish, rising, narrowing wedges towards the ~0.000019 horizontal confluence which corresponds to the fractal pattern from February 22, 2019:
(click to zoom)
(click to zoom)
Same chart as above but with annotated points selected instead of the annotated the February 22, 2019 correspondence:
(click to zoom)
Thus strong confluence signals for a spike low between February 20 and 24 before rocketing higher.
Disclaimer: This is not investing advice. This is for your entertainment. Consult your own professional (perhaps licensed) investment adviser. I am not responsible for any decisions to make after reading my post.
hey anonymint we could need your experience in consensus mechanisms
regarding steemit and the justin sun problem. Is steemit a classical 2 phase quorum with 2/3 tresholds or is it prone to 51% attacks?
https://steemit.com/steemtron/@lauch3d/there-is-no-51-attack-in-steem#comments