Bitcoin – This is what’s happening
Today I’ll do my favourite type of TA post: where I show you charts and let you make up your mind. I’ll point out the patterns and movements which I see – you get to decide if I’m right or not. (Spoiler alert – I’m pretty good at being right…)
Chart 1: The Long-term chart
The long-term chart is important because it sets the “climb angle” for BTC as a whole. I have seen several long-term logarithmic charts lately, with each successive bull markets showing a declining angle of climb. I don’t consider those charts to be correct. The technical analysis of such charts clashes with the fundamental analysis. They rely on the accuracy of very early data which I believe is outlying data and which is not representative of accurate growth.
I believe that the changeover from unreliable to proper, representative data took place during 2013, and that anything prior to that has little value as part of the greater BTC growth equation. With all that in mind, this is what the long-term chart looks like (according to Bit Brain):
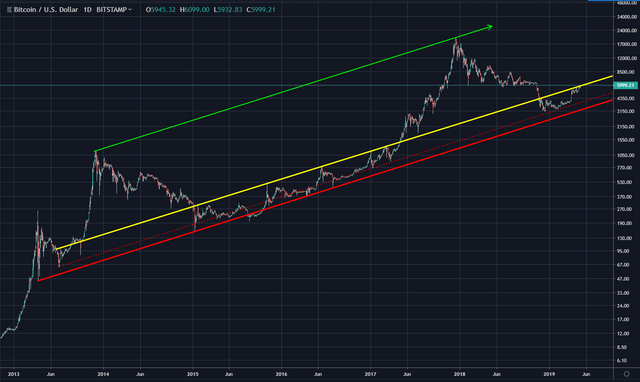
All lines are parallel (thereby representing perfectly logarithmic growth).
- Green Line = upper limit,
- Red Line = lower limit (breached once in 2013 – but seemingly more accurate than any similar line),
- Dotted Red line = general low price line between bullish growth and bearish contraction periods,
- Yellow Line = general high price line between bullish growth and bearish contractions periods.
Chart 2: Long-term (zoomed in)
This chart allows us to see where we are at the moment in greater detail. It is the angle of these lines which I base my often used diagonal Fibonacci levels on. Right now it shows us at the upper limit of this channel, which is one of the reasons why I am expecting a retraction in the near future. I still think it is too early for a proper bullish breakout – a breakout which would first require consolation at a level of about $6500 or greater.
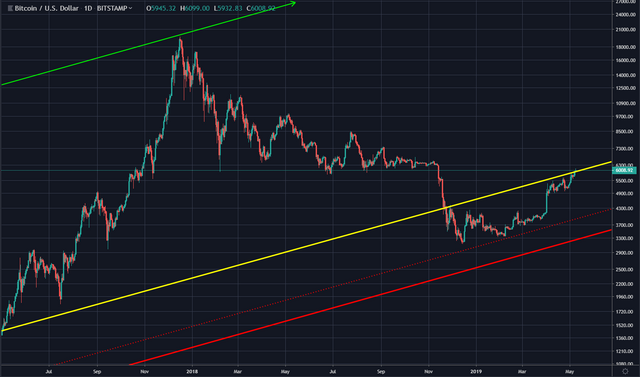
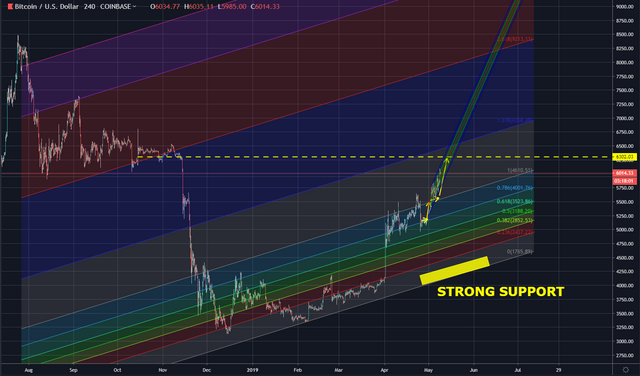
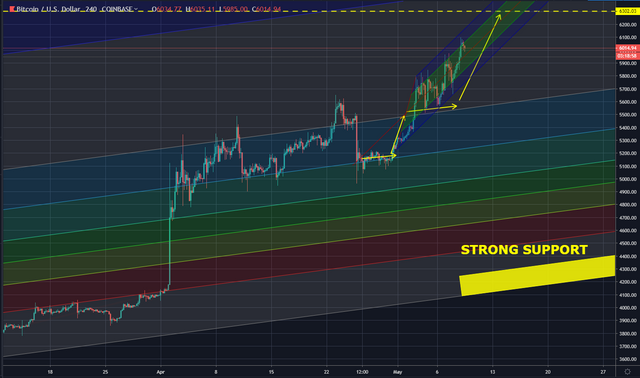
Chart 3: Short/medium-term chart
Chart 3 shows the yellow prediction arrows I first published on 10 April. I’m calling that a win for me. It also shows the diagonal Fib levels which I spoke about when discussing Chart 2. My arrows have the BTC price climbing to an estimated level of $6300. I’m expecting real resistance from about $6250 which was a very solid support layer in 2018.
The channel on the chart shows the short-term climb angle. Once BTC leaves that channel a retraction should occur.
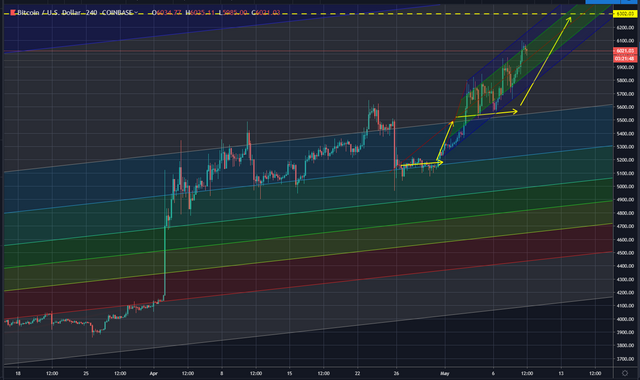
Chart 4: Support level
If a retraction occurs now, I expect it to drop to the low $4000s, where very strong support is to be found.
That very strong support comes from the dotted red line on the long-term chart. Zoomed out, the strong support looks like this:
Chart 5: Support level (zoomed out)
Here you can better see how the diagonal Fib levels have provided support recently. You can also see how my $6300 level estimate is based on historical support levels from 2018. From $6250 to $6400 I expect there to be heavy resistance.
Chart 6: Volume profile
The volume profile for the last year shows just how much trading has taken place in the low $6000s. As I said above, expect heavy resistance in this region. It also shows how support is provided from the low $4000s downwards.
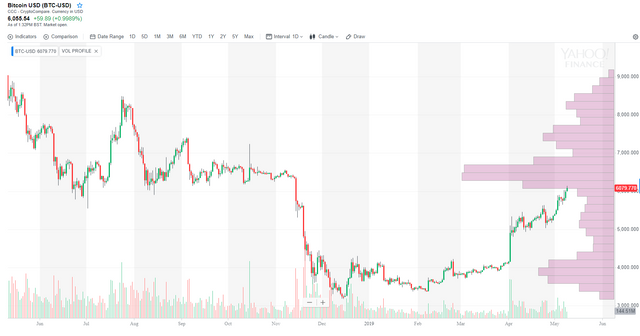
From https://finance.yahoo.com/chart/BTC-USD
Outlook
Considering everything above, I still think that my 10 April post is a valid prediction of the future. The only error in that post is that I predicted price retractions would dip down to the low $5000s a figure which I have since modified to the low $4000s (as explained in this post: “How did Bitcoin cross the Red Sea?”). There is no need for me to add anything else to that prediction at this stage.
I saw many analysts predicting that BTC would turn before hitting the $6000 mark, which honestly puzzled me. Obviously they have been proven incorrect. Once again this is a reminder to all that you should look at both the technical and fundamental reasons behind a prediction, and that no analyst can tell the future with certainty. This is the part where you now need to decide for yourself: “Is Bit Brain correct or is he not”. Indeed you should apply a similar decision to everything you read, no matter who wrote it.
For those who are a little newer to the crypto game than most: I expect a retraction soon. Don’t panic! Bitcoin can go to $4000 and be absolutely fine. That is completely normal and I have no doubt that it will bounce back strongly and will be trading far above $6000 in the latter portion of the year.
Yours in crypto
Bit Brain
All charts made by Bit Brain with TradingView unless stated otherwise.

"The secret to success: find out where people are going and get there first"
~ Mark Twain
"Crypto does not require institutional investment to succeed; institutions require crypto investments to remain successful"
~ Bit Brain

Bit Brain recommends:
Crypto Exchanges:


Solid analysis. Yeah, the 6k level was my recent upside target before a potential pullback in the near term. I need to get more of my BTC liquid so I can adjust my position size when appropriate.