$50,000+ n00b predicts BTC trend for 2018 Xmas/NYE
1 picture = 10^3 words
The following theory is based on visual pattern recognition from a series of .png images taken from coindesk Each one is a graph of BTC price in USD over a given date range. Most span a year from Jan 3 to Jan 3. This is partially in honor of the first BTC mined on a January 3 2009. A few graphs are different and I think the reasons for that will be immediately clear upon viewing.
My point in a nutshell
In case this is TL/DR here is my basic point. Peaks occur in summer (Jun-Aug) and/or at the turn of the year (late Nov- early Jan)
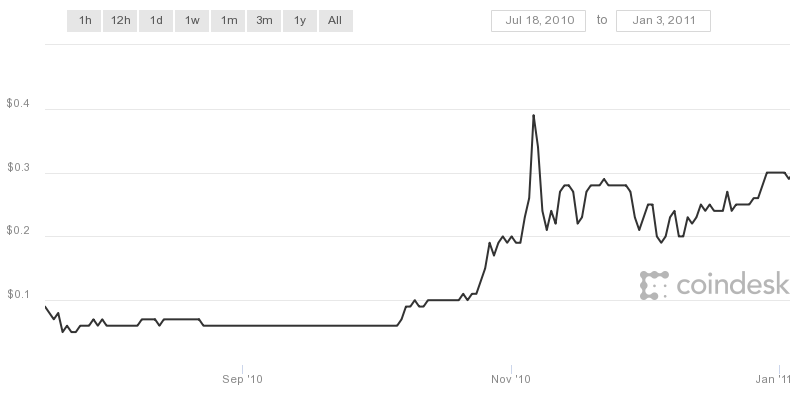
Mid November Spike 2010
Our first graph is from Jul 16 2010 until Jan 3 2011 since BTC price was negligible before that. Here we see that BTC price spiked dramatically to 0.4 USD in mid November
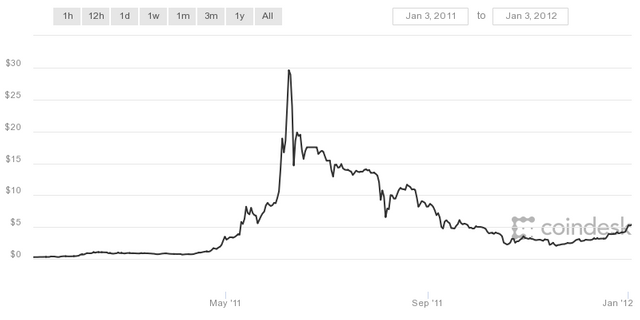
Moon in mid June 2011
The $30 price on June 9 makes the previous spike look like a flat line in comparison.
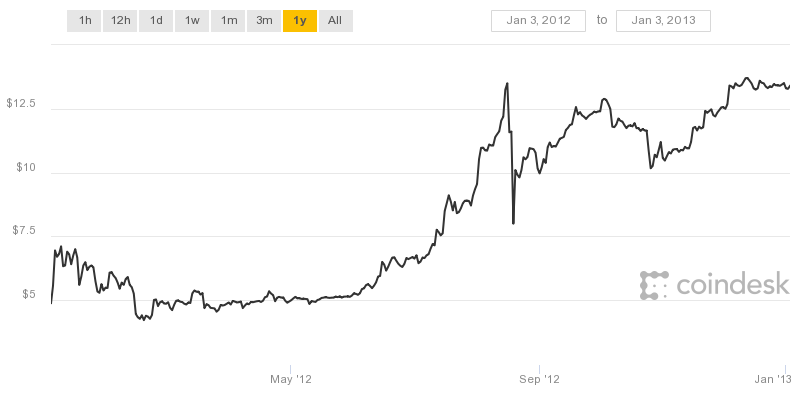
Highs in summer and winter
Global warming jokes aside this is the first year we see a double bull market. Although the new ceiling of $12.50 is beneath the previous years spike anyone buying the dip in the spring/autumn could have reaped significant gains.
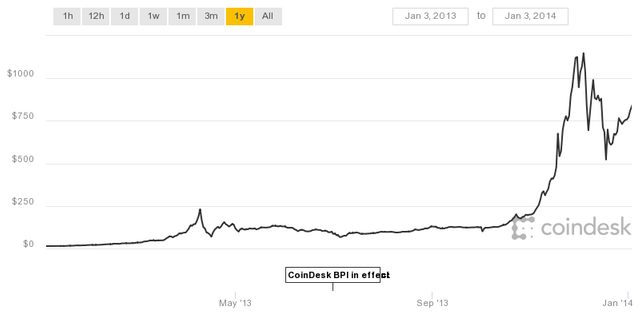
North pole is bullish on BTC
Although the ongoing price of 12ish USD now looks like zero; we also see a spike of $250 in April (mulligan). All of this pales in significance to BTC passing 1,000 USD twice in late Nov and early Dec.
I'm guessing everyone was panicking
I think I remember feeling vaguely smug at this time since I hadn't invested yet.... Anyways, you will notice that although bears dominated there was a rally with lasting support throughout the summer of 2015. The price dropped in the fall, per the usual, but did not rally in Nov, Dec, or early Jan. until......
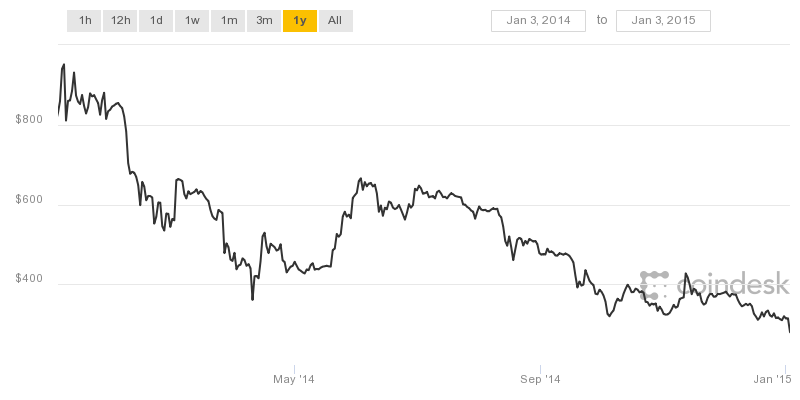
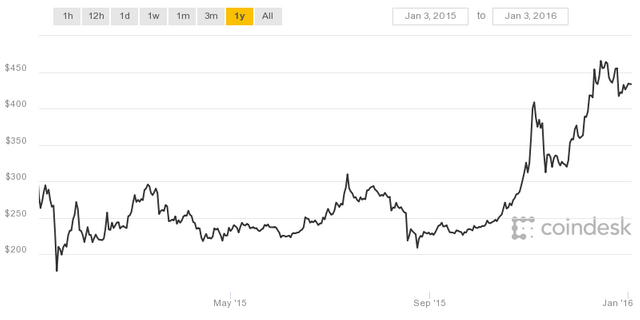
Remember this is about shapes not numbers
The price goes up and down but stays around 250-300 USD. Importantly, the line spikes again, first in late Nov and again in early Jan. The new "high" is beneath the previous years. My point here is that buying in the fall or spring and selling in the winter bump would have earned big returns.
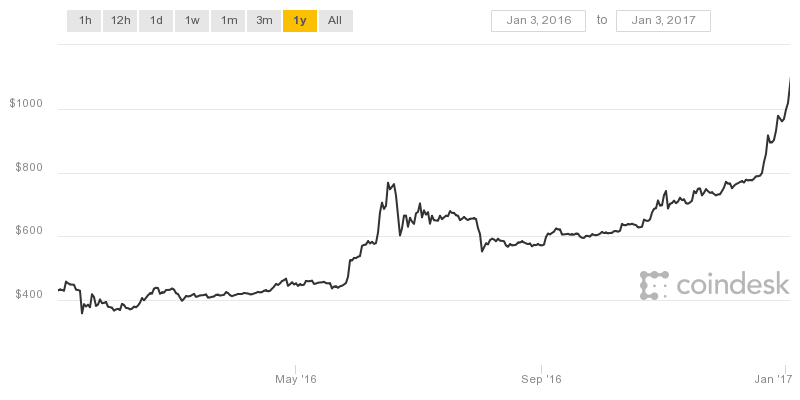
Recent history
In 2016 the price recovers nearly to its former high in the summer (dip in spring peak in summer). And passes 1000 USD again in mid Jan. Again buying in the fall and selling in the winter would have gone swimmingly.
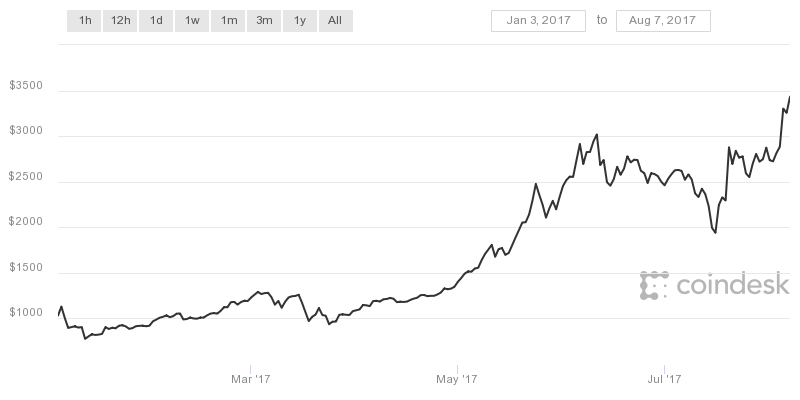
Two for one
This is the graph that finally smacked me across the face hard enough to start participating. I'm sure anyone (who's not a bot) reading this doesn't need me to tell them that the price approached $20,000 in the winter of 2017. The reason I'm including two graphs under this header is because the first one makes it look like there was only one moon mission in 2017.

When in fact the summertime peak of $3k was a 300% gain over the previous peak from two years prior. It just happened to be dwarfed by winter gains of 666%. Hail Seitan
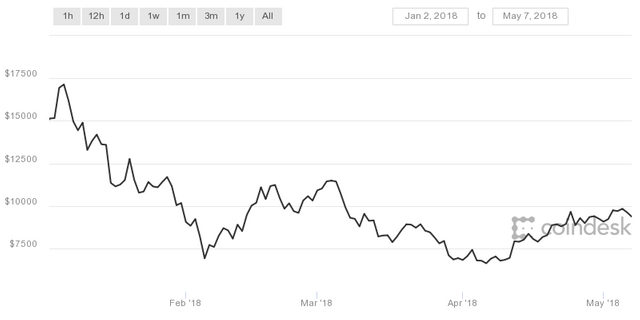
Where are we now?
So we had a springtime bear run and now we are at a pathetic 6k-9k USD/BTC. We aren't yet in the full swing of summer. If the patterns bear out I'm personally feeling bullish for this summer and/or winter.
Partial Disclosure
Right now I'm not holding any BTC at all. It's all Steemit, ETH, and EOS. Personally, I'll probably buy in the fall when I think the price will drop again. If i'm cash rich and the price has dropped before summer is in full swing though I might start cost averaging in.
There may be no spike at all before next year
It happened before (ahem 2014) and it might happen again. Especially if the next article I'm about to write concerning Wall Street pulling a jack move to temporarily crash the BTC price artificially comes true. So you might want to follow and read about that in the near future. Either way I will be conservatively buying modest amounts, especially in the fall and spring until a spike occurs in the winter or summer of the coming year or 2019.
Full Disclosure
This is not financial advice
Ok full disclosure, like it says in the title (I'm a n00b), this is not financial advice and I am not a financial adviser. Furthermore I have no experience in market analysis and no academic background in economics apart from a single advanced placement course in senior year of high school. My academic training is more in the realm of neurology, human biology, and physics. This entire theory is amateurish visual pattern recognition. The above images can easily be found at coindesk
Congratulations @chirocraig! You have completed some achievement on Steemit and have been rewarded with new badge(s) :
Click on any badge to view your own Board of Honor on SteemitBoard.
For more information about SteemitBoard, click here
If you no longer want to receive notifications, reply to this comment with the word
STOPCongratulations @chirocraig! You received a personal award!
Click here to view your Board
Congratulations @chirocraig! You received a personal award!
You can view your badges on your Steem Board and compare to others on the Steem Ranking
Vote for @Steemitboard as a witness to get one more award and increased upvotes!