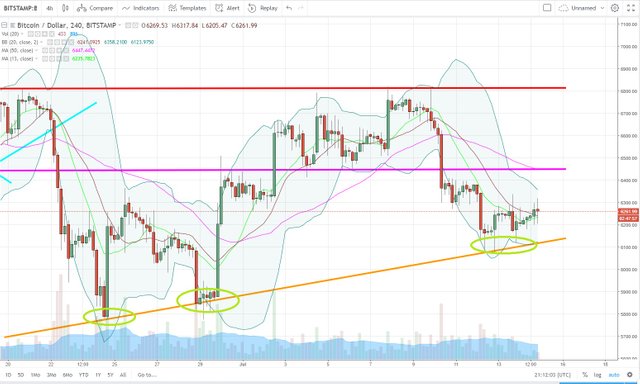
BTC - It looks like the market want test the resistance line
Hello all,
Here was the chart of yesterday :

Here is the current chart :

First good news as at short term, the BTC is not anymore bearish as we stopped to have lower lows. It is just an indication as this trend could change very quickly but at least it is a good news. So it looks like the market want go test the resistance line at 6450$. Let's see the reaction of the market if we do a touch of this line. A break of this line would be very bullish indicator but let's see... because we will need a big break out for that.
I wish you massive profits,
Cryptopassion.io
Disclaimer : Never invest more than what you can afford to lose. This post is my personal opinion, do your own research before making any investment decisions. If you make any trades after reading this post, it is completely in your responsibility. I am not responsible for any of your losses. By reading this post you acknowledge and accept that.

Do you want them spendable directly via a dedicate Visa card ?
You prefer a quick transfer on your bank account ?
I can recommend you the platform Wirex

With my daily exchanges of cryptos, I can recommend you the platform Binance


I'm not big expert in TA but I think it's important to note that with other big factors from news we will have bull market and it can be much bigger than previous. I'm not sure it will be in a few months or maybe longer. But in my opinion it will happen. Obviously not an advice.
Also if you interested in the Crypto currency news reviews here is our latest review of the day
And we collected most interesting news form the past week as well as future important events on the next week.
Here it goes. Have been disappointed a few times when the chart looked like this. Do or die time for BTC.
What do you think?
https://steemit.com/bitcoin/@toofasteddie/bitcoin-the-option-of-inverted-head-and-shoulders-is-now-more-likely-to-happen
To put it short: You are just drawing some lines on your charts based on historical data sets to predict the future. Surprisingly it sometimes work when lot of people are looking at the same indicators.
Random Behaviour of Assets (Paul Wilmott) - private link from CQF
It always starts with the short-term trend ;)
Good luck!