Bitcoin & Cardano Are on the Triangle, Ethereum Has to Fight With Trendlines: Crypto Price Analysis Update, Sept. 17, 2018

Bitcoin is on the “descending triangle”
Over the weekend we moved sideways between the strong areas. Our resistance was the March low at $6,533 and our support was the April low at $6,425. We break downwards from the older counter trendline which is not so remarkable anymore because there are other and newer counter trendlines, but still it could be a small sign.
The weekly candle closes just below the round number at $6,498, so, Bitcoin took down two out of four major resistance levels between the $6,425-$6,533.
Remember we had two weeks ago the "engulfing" candlestick pattern which indicates that we could get another leg down but we didn't. So, this will show us a little bullish hold/momentum on the BTC chart and if you remember, in August, we had a pretty strong monthly candle close (let's say a sloppy "hammer") which could be the reason why we didn't fall further because this monthly candle indicates a little bullishness on the Bitcoin.
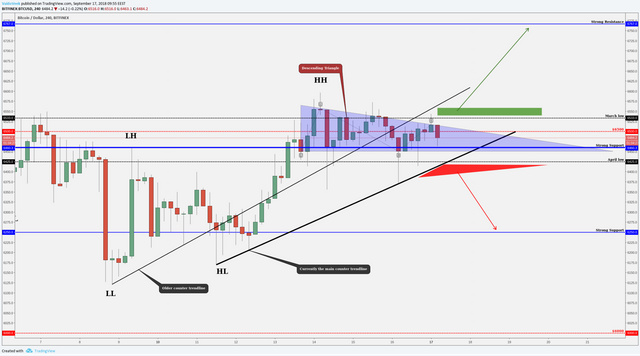
On the four-hour chart, Bitcoin has drawn a bearish chart pattern “descending triangle.” It is pulled from the bodies and soon, it is ready to make a breakout.
The triangle means that we have breakout opportunities to either direction, descending means that we have just a slight advantage to break downwards so, a candle close below the 'currently the main counter trendline' and below the April low level will be a sign that we go downwards (red triangle is the confirmation area). Bullish confirmation would be a candle close above the "descending triangle" and above the March low. Then we got bullish momentum from the chart pattern breakout and if we take down all the major resistance levels from this area then this could be another momentum sign. So, a close above the $6,533 could mean another leg upwards (green box on the chart) and a close below the counter trendline could mean another leg downwards (red triangle).
Ethereum (ETH/USD) has to fight with the trendlines
Overall, the altcoins show us a nice and steady climb upwards which will be a good sign for the whole market. Currently, like Bitcoin, Ethereum has to fight against the strong resistance. The Ethereum price is around $218 and just above us are two trendlines: the longer and smoother since April 1, 2018, and the trendline since July 29 (pulled from bodies). Those trendlines make a cross just above the current price, plus we have a 'naked' resistance area (orange box) and we approaching into the 100 EMA which starts to work as a resistance.
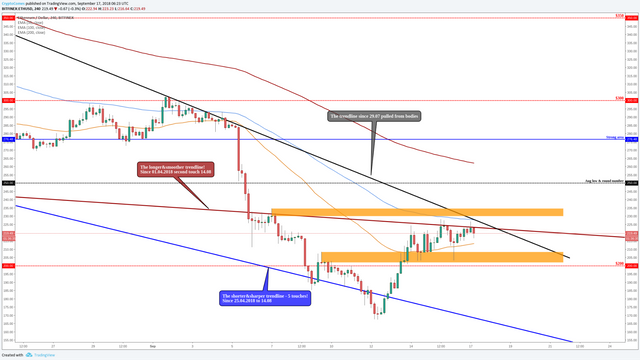
So, after we calculate those criteria we got a pretty significant resistance level. If we want to beat that then Bitcoin definitely has to make a breakout upwards from the triangle then the other altcoins could find the momentum and should follow this move upwards. If we don't catch this momentum then we might go and test the lower levels and the next supports are the orange area below us and the round number $200.
Take a look at Cardano (ADA) Price Analysis, Sept. 17, 2018
Have a nice day!