BITCOIN Weekly Chart Analysis
Greetings everyone, hope you all had a great weekend! I thought I'd take a moment here to talk about the weekly chart for Bitcoin and what we're seeing, hoping, thinking, etc...
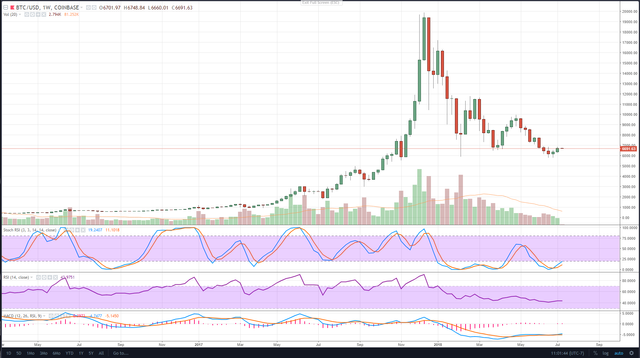
First off, let's look at the obvious parabolic formation that took place last year. We knew this longer pullback was expected based off of the weekly parabolic rise. Also, let's look at the heavy volumes hitting right around the peak. Now, we see volumes tapering off week after week as buyers dissolve and bids are no longer placed. This market dynamic leads to collapsing prices.
Let's look at technical analysis. Weekly RSI is at 43 right now, meaning we're not super bullish looking yet. This will take time but the good news is we are seeing some stabilization. Stochastic RSI is bullish looking which I've mentioned before is typically our first indicator since it's a quicker reacting indicator. Now, we could see a move like we saw right after the first big bounce and we'd come back down to send stochastic RSI into the floor. MACD is still bullish but we've been tight and bullsih since the last bounce.
Overall, we can't rely on any indicators, but collectively they can be used to see what we think might happen. Volumes are still going to be something we rely the most on. Right now, they are coming down and there's a high likelihood that we will see consolidation on the weekly. Technically, we are already in consolidation right now with a bear flag.
The good news too is that on the shorter time frames, we are looking at the stair step bounce still playing out. If we can keep seeing the bulls spike and support with the bears taking a break, we can see upside. These moves don't give that much confidence for stronger support though, so it's definitely something to keep an eye on.

Good post. Your analysis is appreciated