Bitcoin TA - summary of analysts - 02. June 18
Regular daily update on BTC ta analysts opinions.

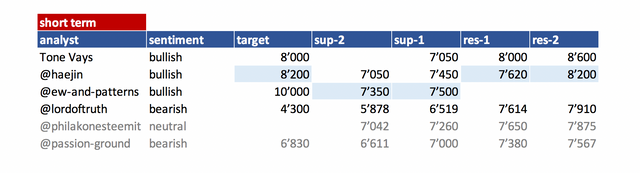
**My summary - short-term sentiment: bullish ** (last: bullish)

Comment unchanged:
- Critical support 7'000 - 7'200 bounced us and seems to establish itself as swing low holding us for some time.
- We have Tone and @lordoftruth seeing this move up short lived and lower lows coming soon.
- Tone did switch short term (12hr chart) bullish while staying bearish on the weekly. He is seeing us going up to 8'000 - 8'600 max and than down.
- @haejin turned fully bullish seeing us going up in impulsive wave with potential huge run up.
- So it looks short term bullish.
- Still we need to break in this move 10'000. If not the likelihood of seeing new lows is increasing significantly. If we fall below 7'050 it will be very ugly.
- May is usually a strong month. But not this year. We started at 9'240 and went all the way down to 7'485 (-19%). Lets see how June plays out -usually also a bullish month. Are we going to see a compensation of May with a huge rally up?

News about the blog
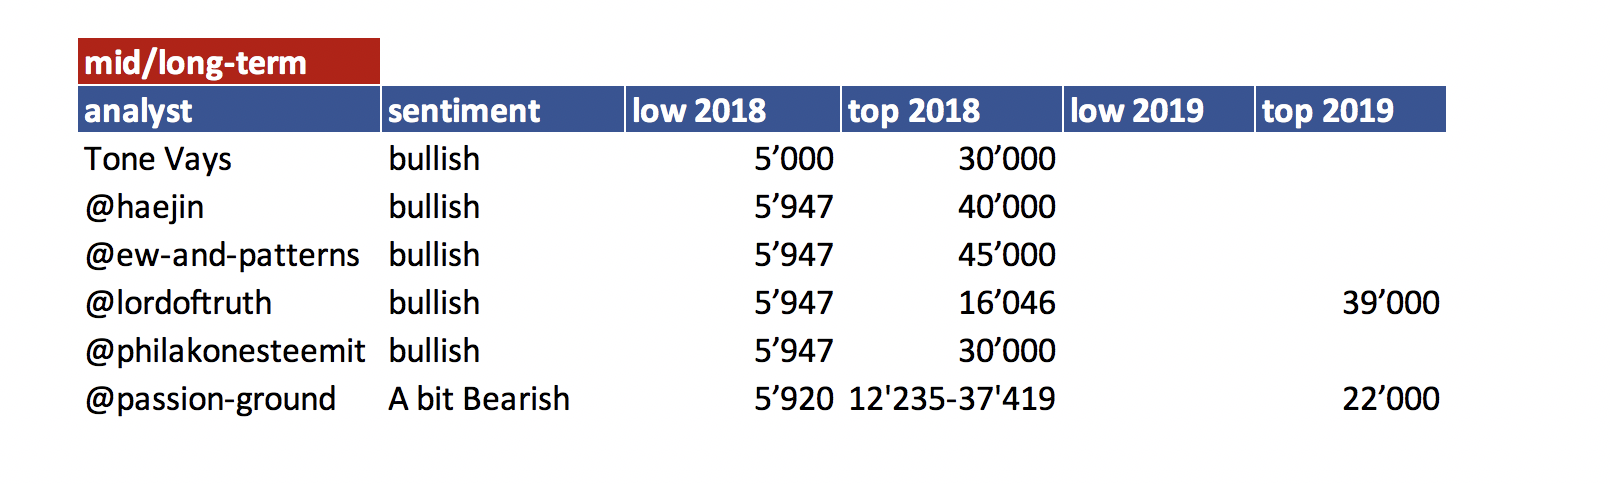
I need to revise my 2018 long term table. I need to add a 2018 and 2019 target an be more precise on the sentiment here. Will do that after I am back in Switzerland.
We lunched the bounty project beta. If you are interested and you like to create a bounty on your own have a look at this post
Analysts key statements:
Tone:
- Weekly:
Unchanged comment:
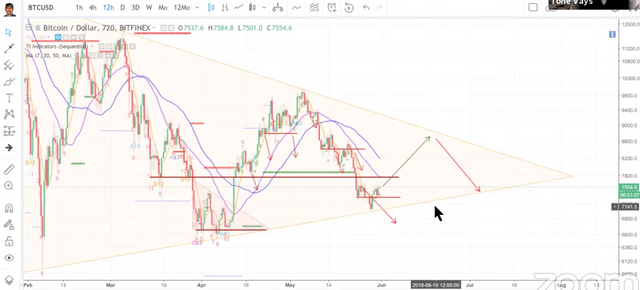
Nothing has changed. Continues to compare this week to August 2014. We are below 50 week MA - Daily: He expects this bounce to not go higher than 8'000. CMF slowly moving to the downside. RSI got just to oversold and started to pick up
- 12hr: There is a chance that the price of bitcoin start to go up and hit the top of the triangle. Target of max. 8'600 here before going down again.
@haejin:
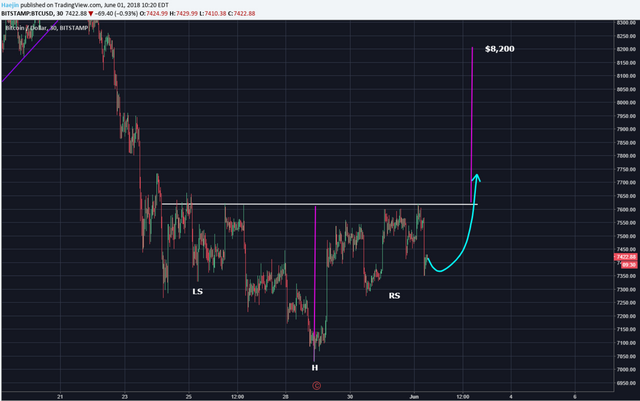
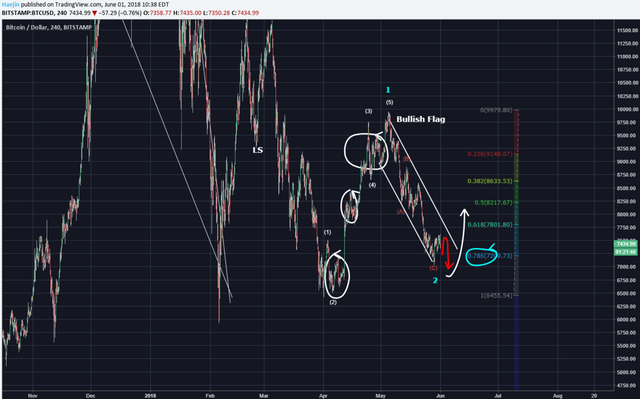
Bitcoin putting in a bullish Inverted H&S pattern as shown in the below chart. The Left Shoulder (LS) is complete as well as the Head (H) and the Right Shoulder (RS) is likely still in progress. This pattern requires a volume confirmation and the blue boxes show that the volume peaks for the H are the highest; thus confirming the pattern.
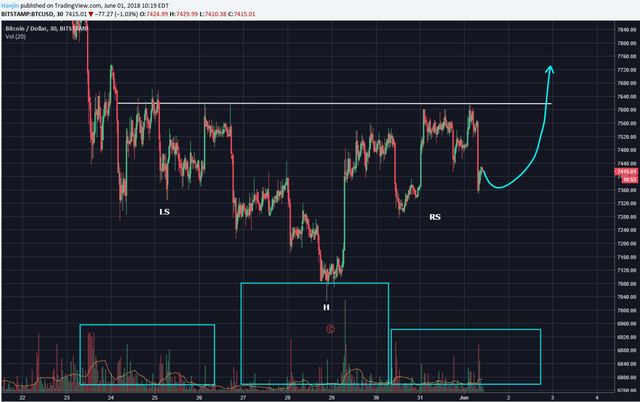
The other confirmation required will be a price confirmation. The horizontal neck line (white) needs to be decisively breached by price as shown by the blue arrow. This would then allow for the minimum price target of 8'200. This pattern is not yet complete nor yet confirmed.
The alternate pattern is shown below. An upward bearish wedge shows that price has already decisively broken below the lower trendline. Given how far away from the apex was, the breakdown may not be very sustainable. It also did have a declining volume confirmation.
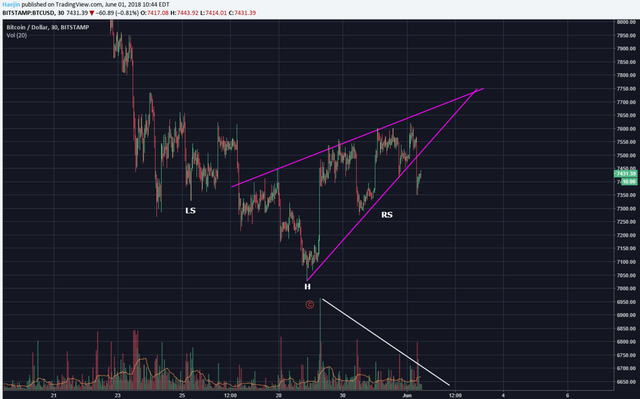
IF the wedge pattern is correct, then there is a potential for price to target the middle of the third cluster of support (white circle). This pathway is shown by the red arrow and could coincide with the 0.88 Fib Level. However, this is an alternate scenario while the IHS is the primary.
@ew-and-patterns:
Good news everyone! This is really easy right now.
If 7'350 is not breached, we have a new uptrend. This level is important now. It cannot be wave 2, if it is breached though. Then we have to revaluate. But until then, this is the count:
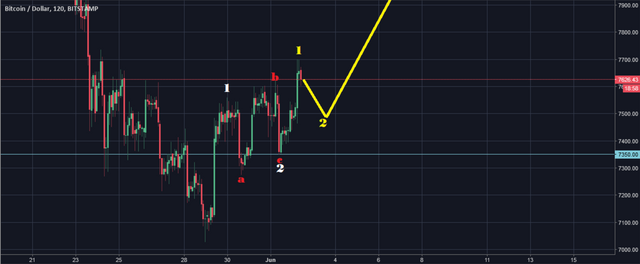
7'350 is a clear stop level for traders, because it is the invalidation point.
Notice the overshooting wave b? This often occurs in a running flat pattern like this.
The right shoulder of this inverse Head and Shoulders pattern (iSHS) is done now. A yellow wave 2 bounce fits the picture perfectly before this pattern is triggered in yellow wave 3.
@lordoftruth:
Bitcoin is trading around 7'500 and the chances is still valid to achieve more decline to extend losses to reach 6'519 - 5'878 - 4'300 as long as the price Below 7'910.
The 2 weekly bearish stop grabbers after breaking 7'614, suggest drop below 6'519, to test 5'878 reaching 4'300 area, the Same Destination point of the Butterfly "Buy".
Todays trend is bearish. Trading between 6'915 and 7'614.
@philakonesteemit:

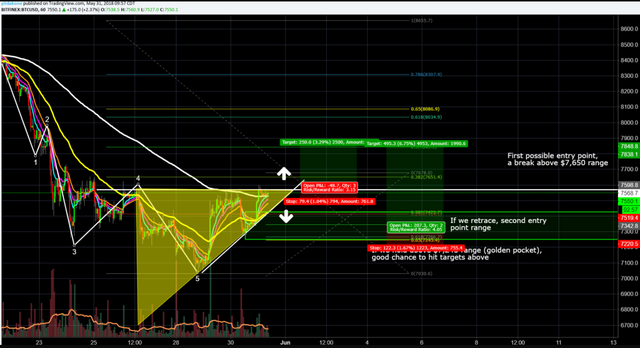
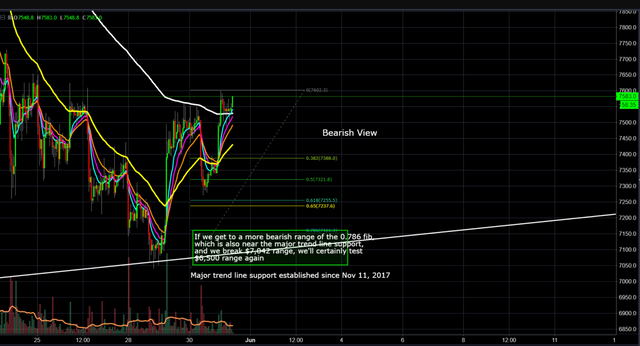
A bounce at the 7'000 level was much expected due to hitting a major trend line support established since Nov 11, 2017.
Bullish View, if we break the 7'650 range, there's a chance to hit 7'850 to 8'000 range (0.5 to 0.618 fib retracement)
Bearish View, if we break 7'161 range, we'll most likely test 7'040, which I see as failing to hold and then testing 6'500.
@passion-ground:
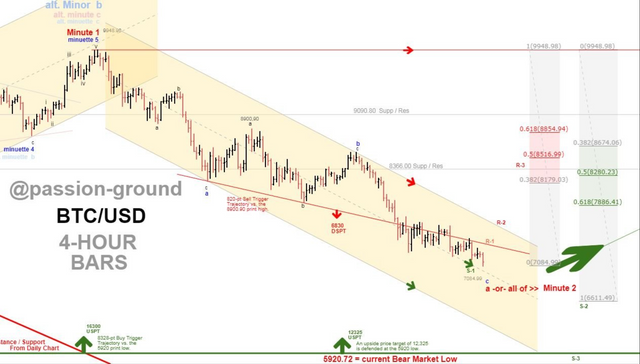
At present, BTC can’t get out of its own way. So, where is the bottom? He sees 6'830 as a possible bottom.
Summary of targets/support/resistance
Reference table
| analyst | latest content date | link to content for details |
|---|---|---|
| Tone Vays | 01. June | here |
| @haejin | 01. June | here |
| @ew-and-patterns | 02. June | here |
| @lordoftruth | 02. June | here |
| @philakonesteemit | 31. May | here |
| @passion-ground | 29. May | here |
Definition
- light blue highlighted = all content that changed since last update.
- sentiment = how in general the analysts see the current situation (bearish = lower prices more likely / bullish = higher prices more likely)
- target = the next (short term) price target an analysts mentions. This might be next day or in a few days. It might be that an analyst is bullish but sees a short term pull-back so giving nevertheless a lower (short term) target.
- support/res(istance) = Most significant support or resistances mentioned by the analysts. If those are breached a significant move to the upside or downside is expected.
- bottom = -> now renamed and moved to long term table. Low 2018
- low/top 2018 = what is the low or the top expected for 2018?
Further links for educational purposes:
- From @ToneVays: Learning trading
- From @philakonecrypto: Like in every post you find links to his amazing educational videos. For example here
- From @lordoftruth: Fibonacci Retracement
- From @haejin: Elliott Wave Counting Tutorial
*If you like me to add other analysts or add information please let me know in the comments.
Valuable information. Thanks a lot.
4hour showing us we have pierced our $7,600 resistance, inverse head and shoulders tested and confirmed. A daily close above this level and we should make a run towards $8,500.
Keep up the good work @famunger. We thoroughly enjoy your daily summary. Head on over to check out our summary of different TA's. I'm sure you'll find the other views interesting.
Very good application for checking cryptocurrency and receive notifications https://masscoinapp.com
The best project for monitoring cryptocurrency status - https://masscoinapp.com
Check the threshold value with comfort!