Bitcoin TA - summary of analysts - 11. July 18
Update of @ew-and-patterns included
Regular daily update on BTC ta analysts opinions.

**My summary - short-term (next 24h) sentiment: slightly bearish ** (last: slightly bearish)

-Overall we are slightly bearish but looking for clear signals for a next move.
Bearish scenario*:
- Rebound is a dead cat bounce turning below 7'000
- Price falls below 6'000 again and quickly gravitates towards 5'500.
- Short term recovery from 5'500 staying under 6'000.
- After breaking 5'500 again a significant drop towards new lows in the range of 4'975 and 4'300.
Bull scenario*:
- We break 6'839 followed by 7'050.
- Volume increases in spikes.
- We go towards the 50 week MA and break above it.
*scenarios based on daily-candles - so around 4-14 days timeframe. See also definition section
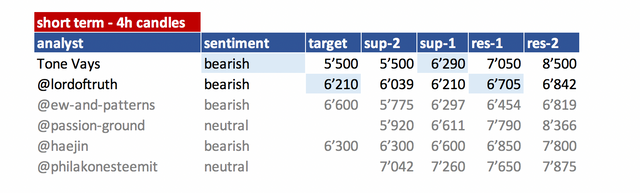
Summary of targets/support/resistance of TAs
Short-term overview
mid- and long-term overview
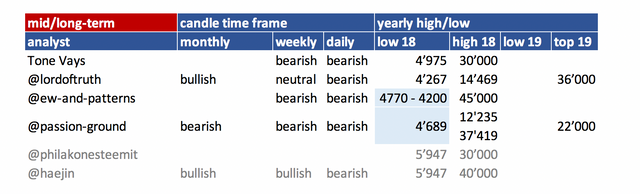
- please refer to definition section for time-horizon.
- you can easily spot which analyst did an update
(block writing - grey ones don't have an update today).
Their changes are in light blue.
Helpful statistics:
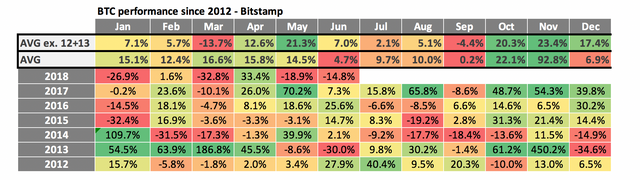
monthly performances
- Added 2012 + 2013 on request.
- As 2012 and 2013 the % move are gigantic I added two averages. One without 2012 + 2013.
- June performance was very weak. With -14.8% clearly below the average of the last years. With 2013 this is the only negative month at all.
- July is a mixed bag - 2 year positive performance and 2 year of negative performance. 2012 and 2013 were positive though.
- The average is positive with 2.1% but that is mainly due to the bull rund 2017. The average incl. 2012and 2013 is even more positive. That is mainly due to the 40%+ spike in 2012 so I wouldn't rely on that.
So just looking at this table we probably facing another negative month.
News about the blog
- Will look for some replacements for @haejin and maybe philakone. But until than I keep them as placeholder.
Analysts key statements:
Tone (bearish):
Mid-term outlook: -> He expect this to be later than expected.
He sticks to his 5'000 target with same probability. The timing might be off though and we reach it later (end of July/ August). From there we probably bounce strong towards 7'500 and more. For now he keeps this target.
Still he is expecting that we put in a final low only at around October.
Short-term outlook:
- Weekly: Weekly 30 MA dropped 500 USD in one week. We probably going to have a death cross of the 30 and 50 MA by end of July.
We have a 9 if we close the week at this level. To get a perfected 9 we would need to have a intraweek low below of 5780. That won't be easy. From that we would expect now a 1-4 correction to the upside. Tricky thing is that we already recovered for about 2 weeks. 6'000 can't be defended for ever. He think if we go down to 6'000 we might accelerate very quickly to the downside. - 12 hr: Support at 6'290. If we go below that we probably accelerate to the downside.
@lordoftruth (bearish):
Bitcoin price tumbled yesterday as its attempt to rise above 6'842.
Bitcoin price completed forming Bearish Flag Pattern ( 4H ), settled below EMA50 and broke 6'400.
He is expecting a next move below 6'210, to test 6'039 within 1-2 sessions.
Weekly Setups stands the same and our major target of AB-CD Pattern around 4'300K still valid as long as the price below 6'842.
On Daily Chart we're still watching for AB=CD target also. As a lot of stops could be accumulated below 5'870 lows and once they will be triggered, the price could accelerate lower towards 5'500 followed by 4'300.
Todays trend is bearish. Trading between 6'039 and 6'705.
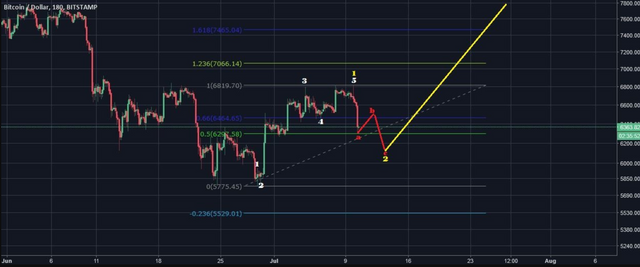
@ew-and-patterns:

He switched back to the bearish scenario as his primary count. Reason for that is that this move up did take a lot of time which is unusual for a solid impulse wave. A huge flat correction (ABC) would explain this undecisive movement and overlapping perfectly.
His target (50% correction) was hit. His bearish scenario this being green wave 1 of purple wave 5 is in play until he sees more bullish momentum. He sees a short term bounce up to 6'600 though.
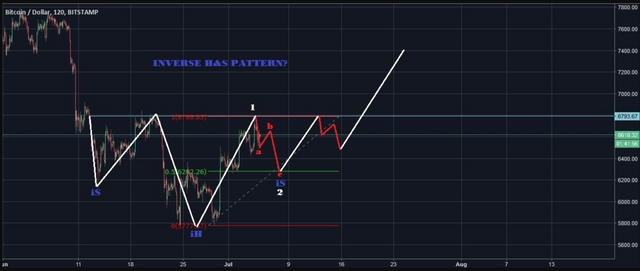
Bullish alternate:
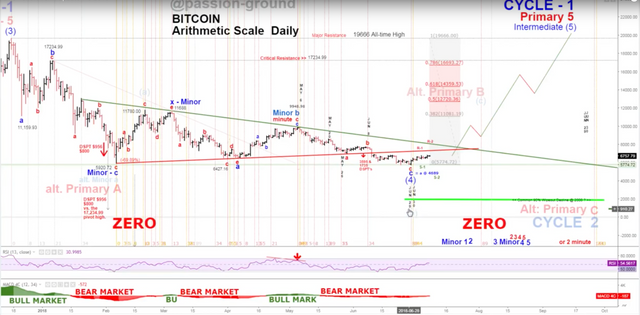
@passion-ground:
Still looking for clues as to the sustainability of the recent bear market lows. Thus far, basis the higher highs, and higher lows, we are the right track short-term.
He is still looking for clues how strong the bounce is. Higher highs and lower lows is a good start. But not yet we have broken through significant resistance levels. Next turn month is August, than January.
@philakonesteemit:
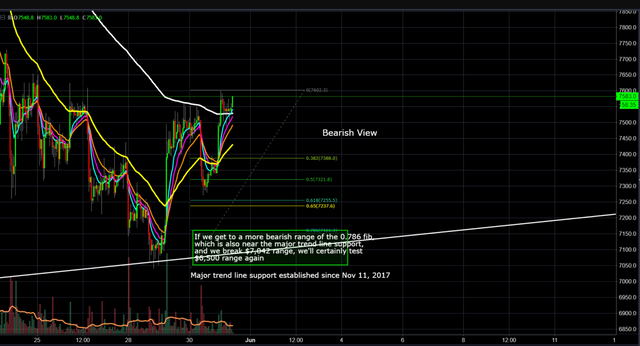
A bounce at the 7'000 level was much expected due to hitting a major trend line support established since Nov 11, 2017.
Bullish View, if we break the 7'650 range, there's a chance to hit 7'850 to 8'000 range (0.5 to 0.618 fib retracement)
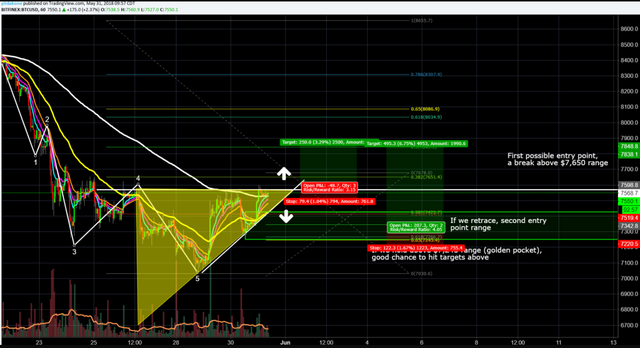
Bearish View, if we break 7'161 range, we'll most likely test 7'040, which I see as failing to hold and then testing 6'500.
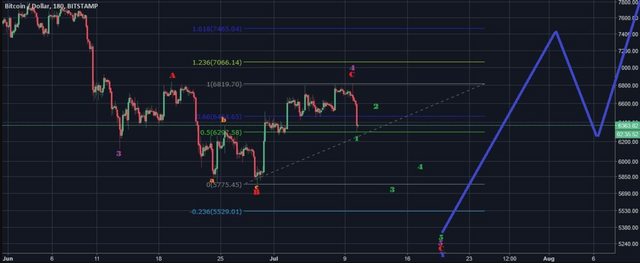
@haejin:
@haejin is moving his analysis to bitcoin live. Those of you who want to follow him directly should look into subscription. I will try to get in contact to see if I can use an abstract to post here also in the future.
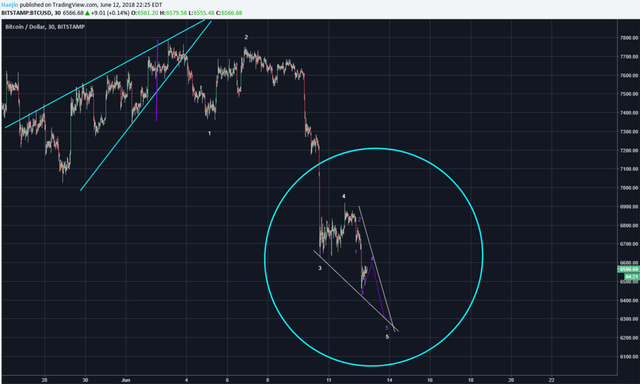
Bitcoin (BTC) Short Term Update: The blue circle shows a potential price pathway of BTC. The purple waves have been updated and it shows a scenario where purple 1,2,3 could be complete and 4 is getting its final touches. Purple 5 is still targeting the 6'300 zone or so.
Reference table
| analyst | latest content date | link to content for details |
|---|---|---|
| Tone Vays | 10. July | here |
| @lordoftruth | 11. July | here |
| @ew-and-patterns | 06. July | here |
| @passion-ground | 09. July | here |
| @haejin | 13. June | here |
| @philakonesteemit | 31. May | here |
Definition
- light blue highlighted = all content that changed since last update.
- sentiment = how in general the analysts see the current situation (bearish = lower prices more likely / bullish = higher prices more likely). The sentiment is based on 4hr, daily, weekly, monthly candle charts.
- The forecast time horizon of candles can be compared with approx. 4hr = 1-2 days; daily = 4-14 days; weekly = 4 - 14 weeks; monthly = 4 - 14 month.
- target = the next (short term) price target an analysts mentions. This might be next day or in a few days. It might be that an analyst is bullish but sees a short term pull-back so giving nevertheless a lower (short term) target.
- support/res(istance) = Most significant support or resistances mentioned by the analysts. If those are breached a significant move to the upside or downside is expected.
Educational links:
- From @ToneVays: Learning trading
- From @philakonecrypto: Like in every post you find links to his amazing educational videos. For example here. In addition he has an online course which you can find here
- From @lordoftruth: Fibonacci Retracement
- From @haejin: Elliott Wave Counting Tutorial
*If you like me to add other analysts or add information please let me know in the comments.
Thanks @famunger ..I always want to read your post and the educational links of the post. Regards
any way to include @thechartguys analysis as a replacement. I do not think they are using steemit strong but the analysis is top notch.
It seems they are only providing information to paying members anymore. So just like @haejin.
It seems all who build up a member base are trying to cash out in the times of the bear market ... is this the right thing to do?
They provide tons of free content daily on youtube but they do have a pay site as well. Thanks for listening to suggestions.
May I suggest others who offer free TA and they are as good as the others, for example, Carl(the Moon) Forflies, (the 17 year old millionaire), The chart guys(very accurate) Marious Landman.(cycle market analyst)
Thanks for bringing him to my attention. I will look into it. On the first look it seems they aren't using steem at all (last post from last year). I will check out their website though.
Hey Chris, I know we still need to catch up on some stuff - but in the interim, here's a post I thought you might enjoy reading.
https://steemit.com/steem/@tcpolymath/a-simple-radical-change-to-steem-that-could-fix-most-of-our-problems
Great article - yeah you are right. Will try to get to it today.
@famunger I would like you visit this contest https://steemit.com/worldcupwithsteembounty/@jmhb85/match-64-or-final-match-predict-the-result-and-win-with-steem-bounty-25-sbd