Bitcoin TA - summary of analysts - 12. July 18
Regular daily update on BTC ta analysts opinions.

**My summary - short-term (next 24h) sentiment: slightly bearish ** (last: slightly bearish)

-Overall we are slightly bearish but looking for clear signals for a next move.
Bearish scenario*:
- Price falls below 6'000 again and quickly gravitates towards 5'500 making a new low before turning to the upside.
- Short term recovery from 5'500 staying under 6'000.
- After breaking 5'500 again a significant drop towards new lows in the range of 4'975 and 4'300.
Bull scenario*:
- We make a higher low.
- We break 6'839 followed by 7'050.
- Volume increases in spikes.
- We go towards the 50 week MA and break above it.
*scenarios based on daily-candles - so around 4-14 days timeframe. See also definition section
Summary of targets/support/resistance of TAs
Short-term overview

mid- and long-term overview
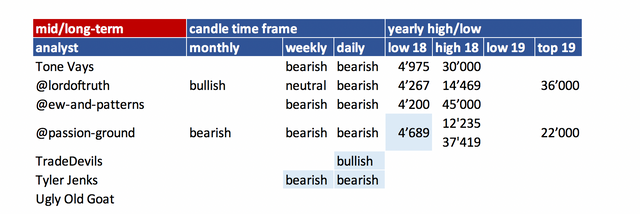
- please refer to definition section for time-horizon.
- you can easily spot which analyst did an update
(block writing - grey ones don't have an update today).
Their changes are in light blue.
Helpful statistics:
monthly performances
- Added 2012 + 2013 on request.
- As 2012 and 2013 the % move are gigantic I added two averages. One without 2012 + 2013.
- June performance was very weak. With -14.8% clearly below the average of the last years. With 2013 this is the only negative month at all.
- July is a mixed bag - 2 year positive performance and 2 year of negative performance. 2012 and 2013 were positive though.
- The average is positive with 2.1% but that is mainly due to the bull rund 2017. The average incl. 2012and 2013 is even more positive. That is mainly due to the 40%+ spike in 2012 so I wouldn't rely on that.
So just looking at this table we probably facing another negative month.

News about the blog
I added two analysts:
@tradedevil: Very interesting TAs. Posting on youtube. Having also a steemit account and posting there but just links to their videos - so not too much added value that may also be the reason why they have not many followers here on steemt yet.
On youtube they have 30'000 follower. Running own trading academy. Will do a summary of those videos.Tyler Jenks: Is an money manager with 30+ years of experience. He is very strong focusing on a concept called hyperwave which explains how bubbles work. Also he uses Cosensio - a MA based system to determine where we at in the lifecycle of a market.
He has his own youtube channel (hyperwave) and does Trading Bitcoin videos often together with ToneVays. Being closely in discussion with Tone - he still has a unique view with a long term perspective. That is why I wanted to include him. He is not posting to often TA on his own. I include him more for a broader picture. Lets see if that can add value.UglyOldGoat: Very experienced trader. Very active on Bitmex. Has a relationship to Tone but a very independent opinion on the market. He posts on medium (if you like follow him there) not very regularly. So that is some kind of "nice to have". We see if that makes sense in terms of he frequency of posting.
Philakone - it seems he just abandoned steemit. On youtube he is focusing on other coins and on "scalping". That is not very well fitting into this summary. That is the reason why I decided to leave him out for now. Very unfortunate...!
Haejin: Bitcoin Live is where he is posting crypto analysis. That is the reason why I am not able to include him anymore. Also very unfortunate.
Analysts key statements:
Tone (bearish):
Short-term outlook:
- Weekly: The previous week gains are an annihilated already. He wouldn't wonder if we even engulfing the candles of the last two weeks. We need to see the close.
Environment keeps being bearish.
Previous comment remains valid:
We have a 9 if we close the week at this level. To get a perfected 9 we would need to have a intraweek low below of 5780. That won't be easy. From that we would expect now a 1-4 correction to the upside. Tricky thing is that we already recovered for about 2 weeks. 6'000 can't be defended for ever. He thinks if we go down to 6'000 we might accelerate very quickly to the downside. - 12 hr: Support at 6'290. If we go below that we probably accelerate to the downside.
Mid-term outlook:
He sticks to his 5'000 target with same probability. If we bounce somehow he expects us to bounce into the death cross of the 30 and 50 MA weekly. That should happen end of July beginning of August.
@lordoftruth (bearish):
Short term:
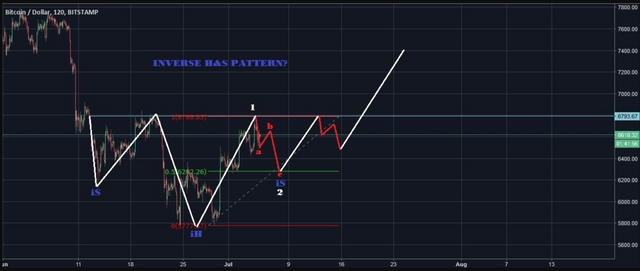
If Bitcoin price is stopped around 6'210, an inverse head and shoulders pattern ( 4H ) will form to show upside bounce within 1-2 weeks towards 7'500 before any new attempt to decline again.
If the bulls fail to hold 6'210, Bitcoin price will drop below 6'039.
To conclude, we have to keep an watching eye on 6'210.
daily
We're still watching for AB=CD target also. As a lot of stops could be accumulated below 5'870 lows and once they will be triggered, the price could accelerate lower towards 5'500 followed by 4'300.
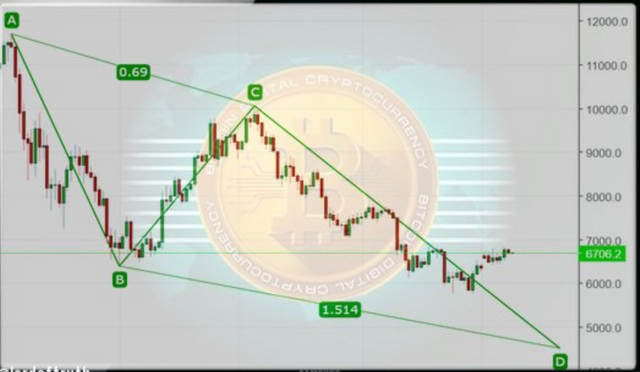
weekly
Stands the same and our major target of AB-CD Pattern around 4'300 still valid as long as the price below 6'842.
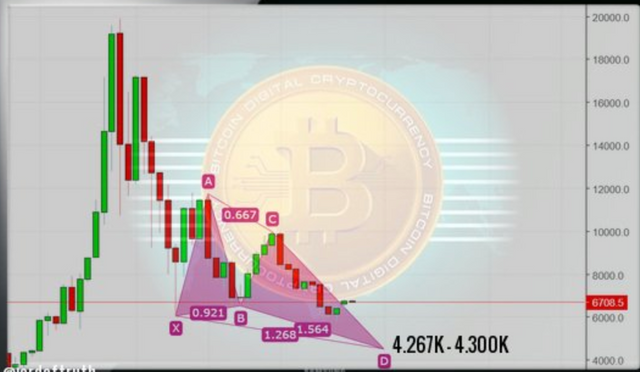
Todays trend is slightly bearish. Trading between 6'039 and 6'705.
@ew-and-patterns (bearish):

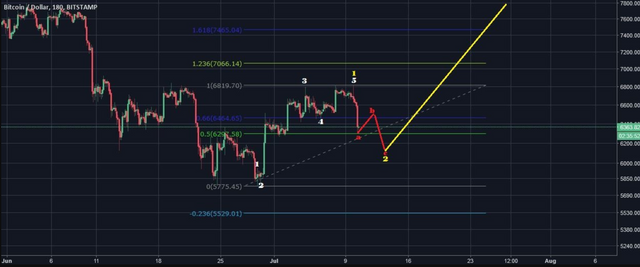
He switched back to the bearish scenario as his primary count. Reason for that is that this move up did take a lot of time which is unusual for a solid impulse wave. A huge flat correction (ABC) would explain this undecisive movement and overlapping perfectly.
His target (50% correction) was hit. His bearish scenario this being green wave 1 of purple wave 5 is in play until he sees more bullish momentum. He sees a short term bounce up to 6'600 though.
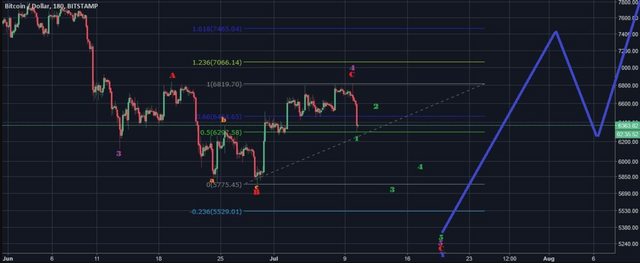
Bullish alternate:
@passion-ground (neutral):

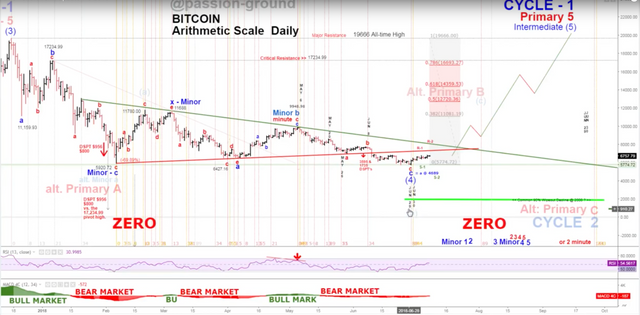
Still looking for clues as to the sustainability of the recent bear market lows. Thus far, basis the higher highs, and higher lows, we are the right track short-term.
He is still looking for clues how strong the bounce is. Higher highs and lower lows is a good start. But not yet we have broken through significant resistance levels. Next turn month is August, than January.

TradeDevils (bullish):
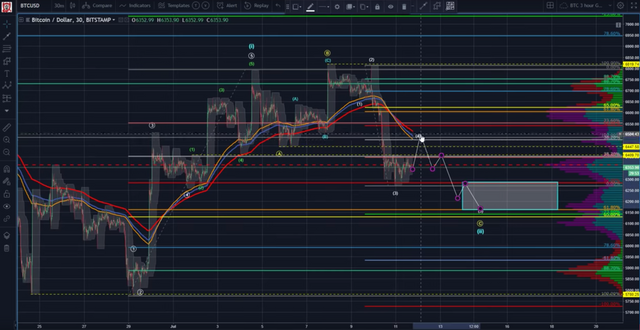
He is expecting us to bounce toward the 6'450 area before going down towards 6'270 - 6'170 which is the "golden pocket" to place buy bets.
Tyler Jenks (neutral):
Short term he only positions himself if he sees a move of the market of 5% in either direction. So at the moment he is neutral but seeing us based on consensio in a bearish market (daily/weekly).
The 7 MA weekly is below the 30 MA weekly and both are declining. That is a bear market by definition for him. Also the 30 MA is accelerating to the downside making it likely to cross the 50 MA in the near future. That would be another bearish sign for him.
UglyOldGoat (bullish):
Beside all analysts who seem to lean to the downside Ugly has a different opinion. He see that fear is influencing the view - looking on the pure technicals he sees based on the TD system
- Quarterly 3 candle correction from quarterly 9
- Weekly buy signaled based on a 9
- 8 hour buy signaled based on a 9
- 4 hour buy signaled based on a 9
IT's time to pull the trigger
The basis, relative strength, the timing indicators all say it is time to pull the trigger and risk 1st and 2nd quarter lows. Yes, if we break it will be hard but that is fear. . . everything else says this is a low risk time and place to be a buyer.
Reference table
| analyst | latest content date | link to content for details |
|---|---|---|
| Tone Vays | 10. July | here |
| @lordoftruth | 11. July | here |
| @ew-and-patterns | 06. July | here |
| @passion-ground | 09. July | here |
| @tradedevil | 11. July | here |
| Tyler Jenks | 05. July | here |
| UglyOldGoat | 12. July | here |
Definition
- light blue highlighted = all content that changed since last update.
- sentiment = how in general the analysts see the current situation (bearish = lower prices more likely / bullish = higher prices more likely). The sentiment is based on 4hr, daily, weekly, monthly candle charts.
- The forecast time horizon of candles can be compared with approx. 4hr = 1-2 days; daily = 4-14 days; weekly = 4 - 14 weeks; monthly = 4 - 14 month.
- target = the next (short term) price target an analysts mentions. This might be next day or in a few days. It might be that an analyst is bullish but sees a short term pull-back so giving nevertheless a lower (short term) target.
- support/res(istance) = Most significant support or resistances mentioned by the analysts. If those are breached a significant move to the upside or downside is expected.
Educational links:
- From @ToneVays: Learning trading
- From @lordoftruth: Fibonacci Retracement
- From @philakonecrypto: Like in every post you find links to his amazing educational videos. For example here. In addition he has an online course which you can find here
- From @haejin: Elliott Wave Counting Tutorial
*If you like me to add other analysts or add information please let me know in the comments.
Is TA stands for technical analysis?
yes it does
Nice "adds" to the stable, brother! It takes a lot of work to keep track of and organize everything the way you do... Hat's off!
Thanks - I appreciate your acknowledgement.
Can you give me some way to get in touch with you?
For what reason?
Looking for a collaboration. Do you have Discord or Telegram?
You can msg me on steem.chat - same account
Good additions, however, in my opinion Trader Devil, takes to much time to get to the point. As I suggested yesterday, the Chart guys because he is straight to the point, support and resistance, inside candles, low lowers and higher highs. They also have good following. Forflies, even though he is a teenager he is capable of doing good TA. The Moon T.A. for today:
The Chart Guys:
Forflies:
Thank you for your information.
Thanks for taking the time to bring those up.
I just took a glance at those videos. Can you give me some more background on those? What makes them credible for you? What were significant good calls they made (you may got a link to those videos?).
Thank you for giving me the opportunity to express my opinion about these traders: They are most of the time right in their probabilities about the price they project the day before for BTC . The chart guys give the resistance, support, inside candles, lower lowers and higher highs and very seldom if ever they miss a call, they have a lot of views a million plus too.
Forflies: use one of the indicator called Ichimoku Cloud among other indicators, I like the Ichimokku Cloud because it predicts where the price will be in the future. Usually if we are trading under the cloud means bearish and vise-versa.
The Moon (Carl) Bitcoin Technical Analysis & Crypto News likes to study patterns. In my opinion they are honest, and accurate. Two of them sell their services, however, they are very generous to their unpaid followers, I like their probabilities,they don't claim certainties because it is only found in an accounting profession, rather than in trading and investing.
Thank you for including me. I'm not too familiar with this platform so I don't know how to message you but am wondering how I can help with creating more value for you in my post. Again, thank you for the support!