Bitcoin TA - summary of analysts - 13. May 18
Regular daily update on BTC ta analysts opinions.

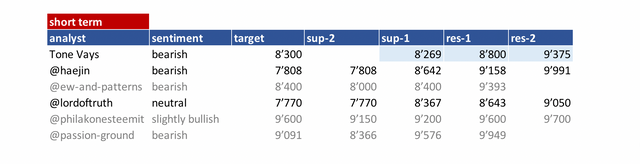
**My summary - short-term sentiment: bearish ** (last: bearish)

- We are found hold and moving sideways at 8'500.
- Still more downside expected by analysts. 8'300 - 7'700 is expected range after a few hours/days of recovery.
- Just realized I have been ahead of time. May is usually a strong month. Lets see how it plays out in 2018.

News about the blog
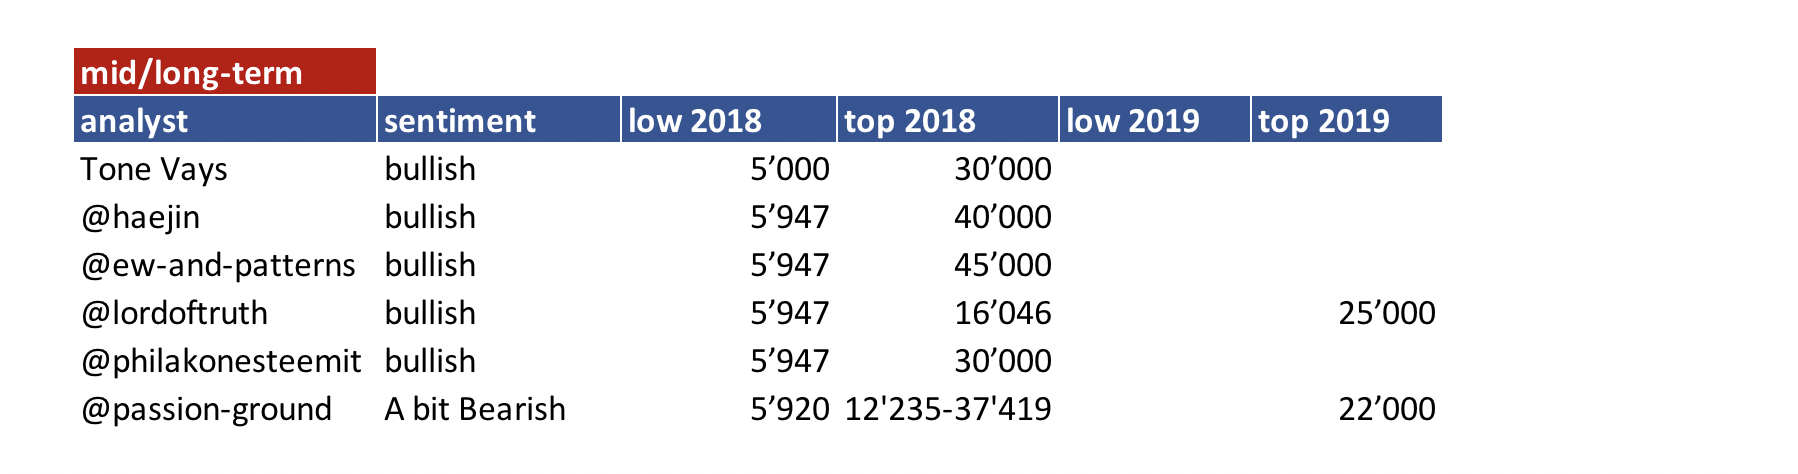
I need to revise my 2018 long term table. I need to add a 2018 and 2019 target an be more precise on the sentiment here. Will do that after I am back in Switzerland.
We lunched the bounty project beta. If you are interested and you like to create a bounty on your own have a look at this post
Analysts key statements:
Tone:
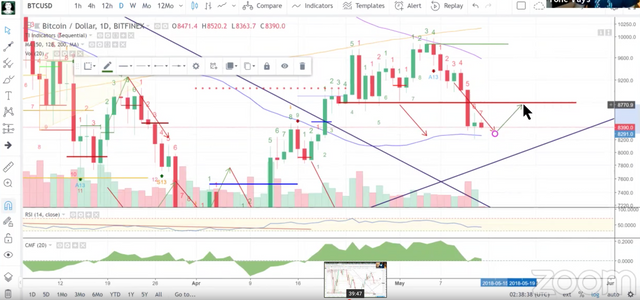
- Weekly: Erased in one week almost 3 weeks of gains. We could have a price flip if we go a bit lower. He is seeing more and more similarities to the 2014 bear market.
To get bullish price needs to go over 30 MA and 7, and 30 needs to move up. - Daily: Is holding 50 MA. It is on 7 of 9. 72 hours of potential downside. It might than go up and recover for 1-4 bounce. That bounce he expects to not go over 8'800 (on the 19th). Than go down to 8'300 (and lower).
@haejin:
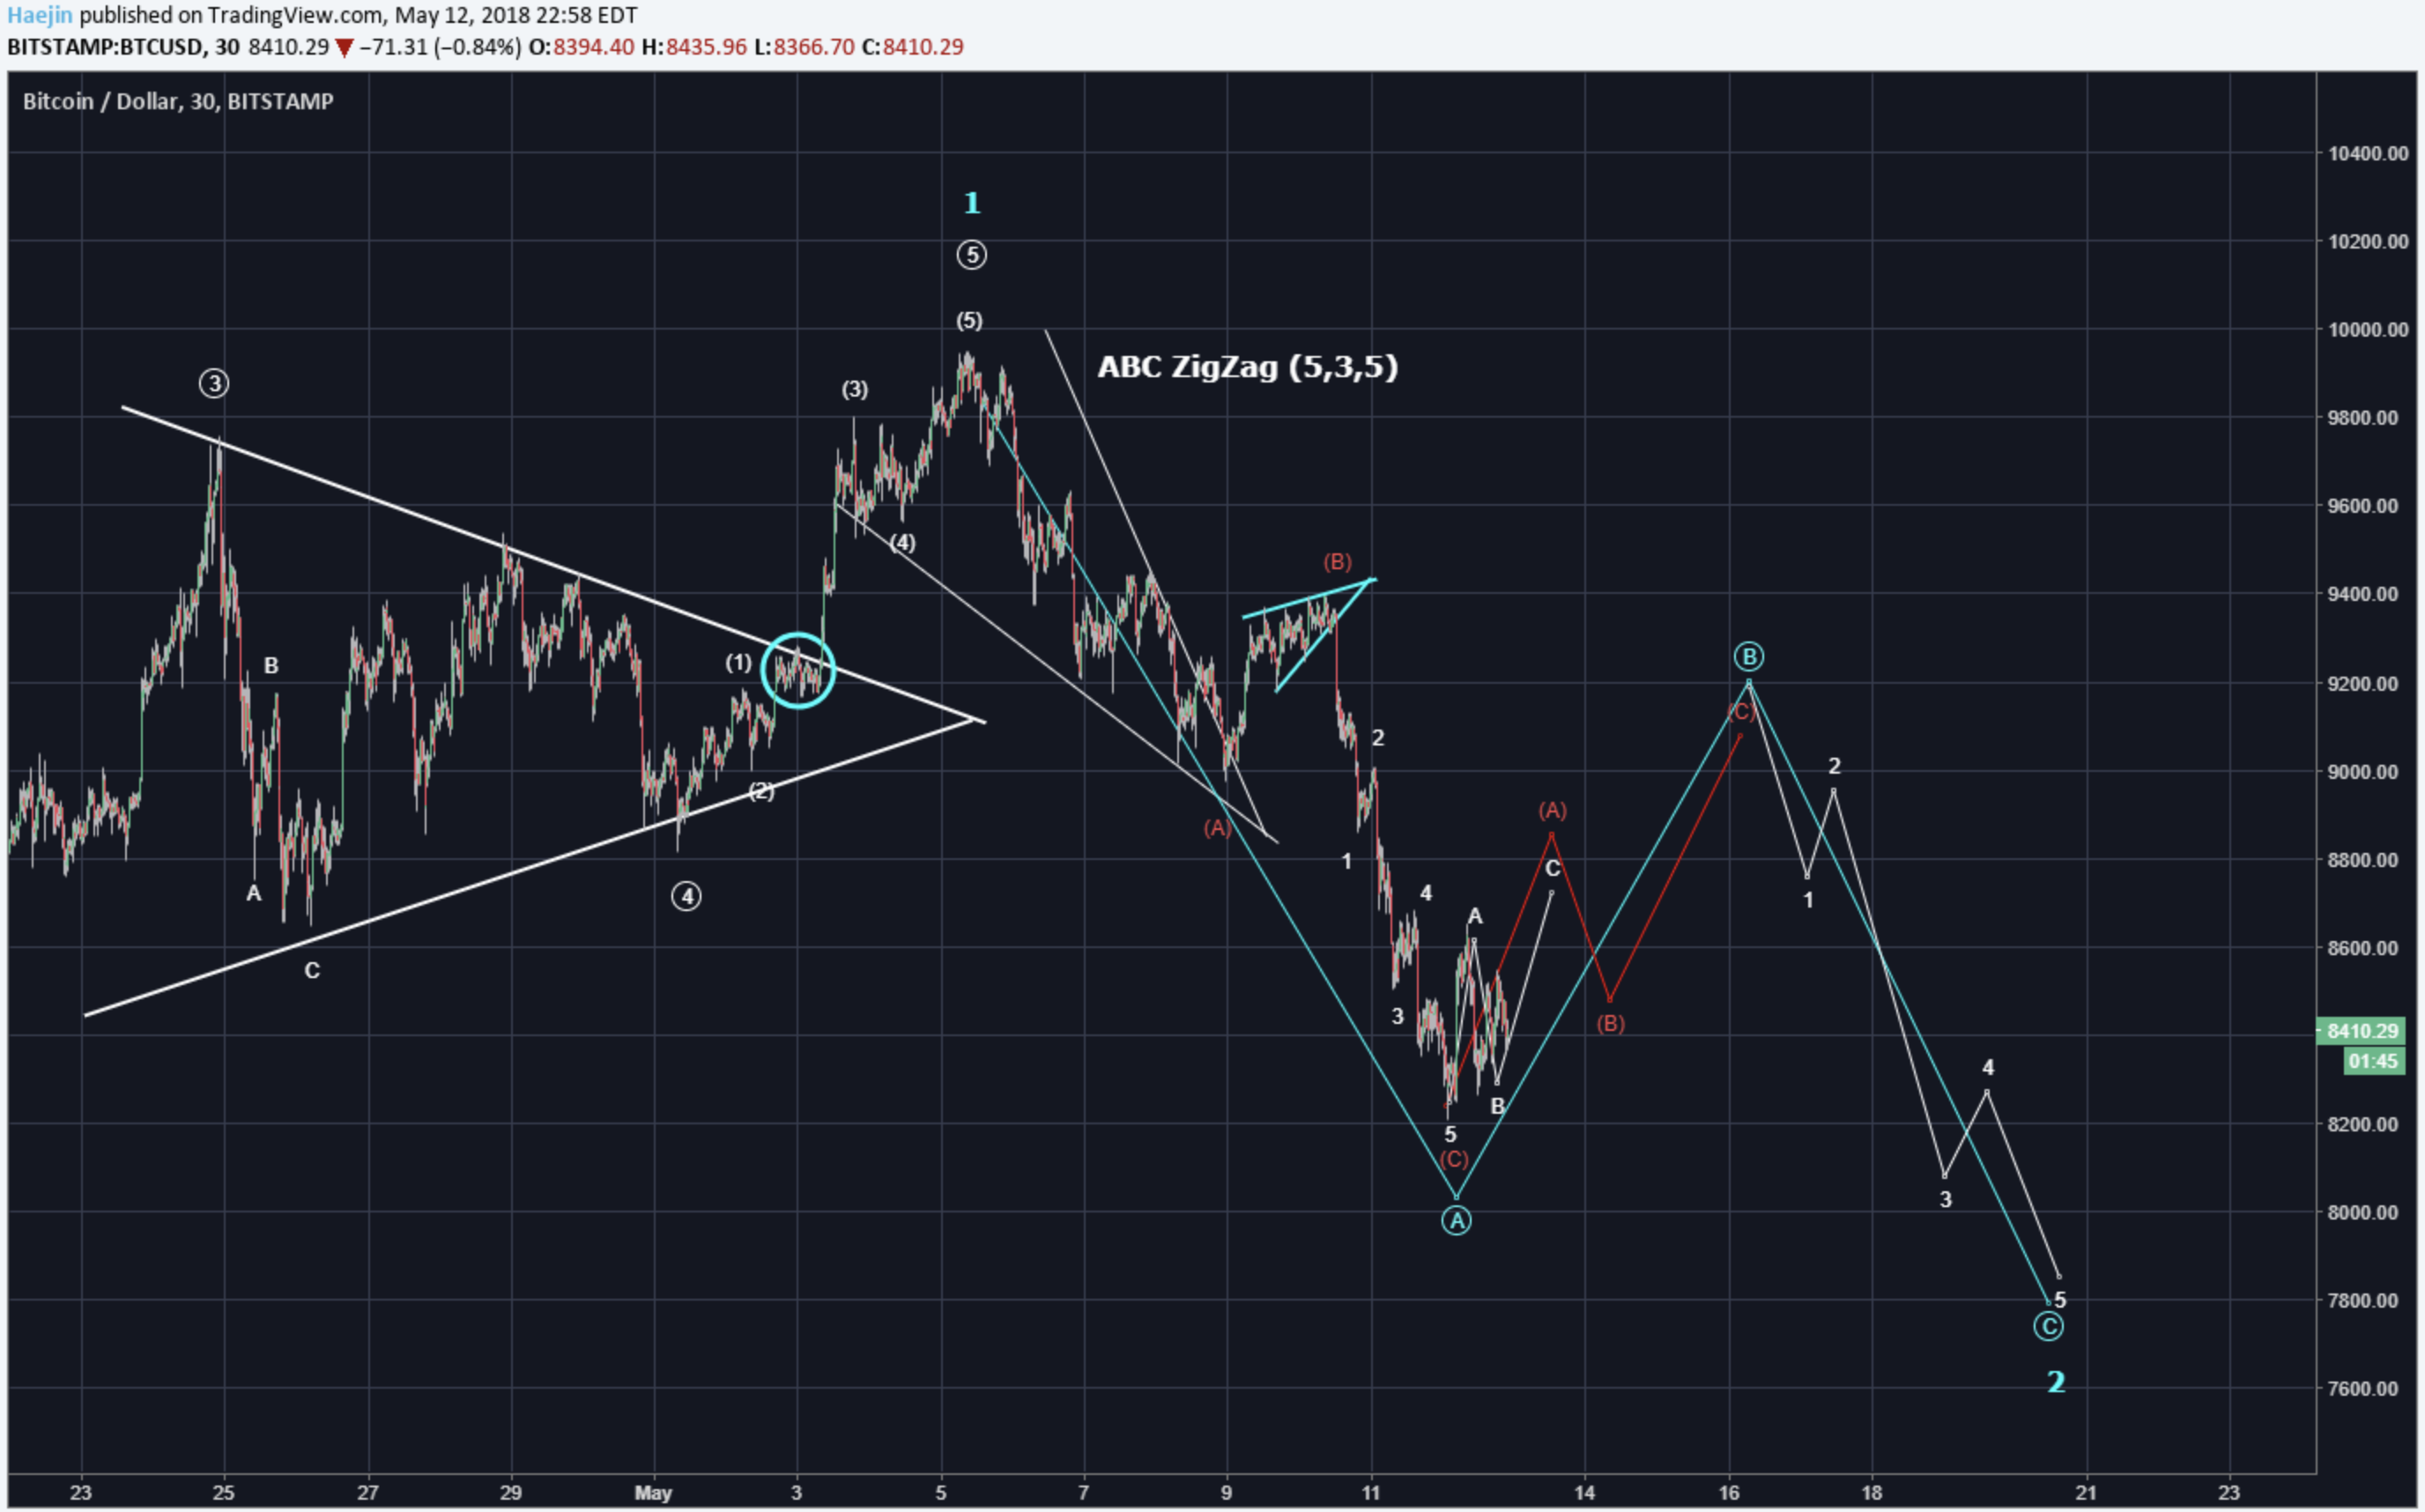
The short term looks to be developing so that the B wave (blue) is in progress. B waves always have three subwaves (red abc). The blue C wave is what might cause some fear as it could bring the price down to $7,800 or so. However, there is a scenario for the price to dip even lower than where it is which means blue wave A is not done yet. Still his main scenario remains a bounce of 7'800.
@ew-and-patterns:

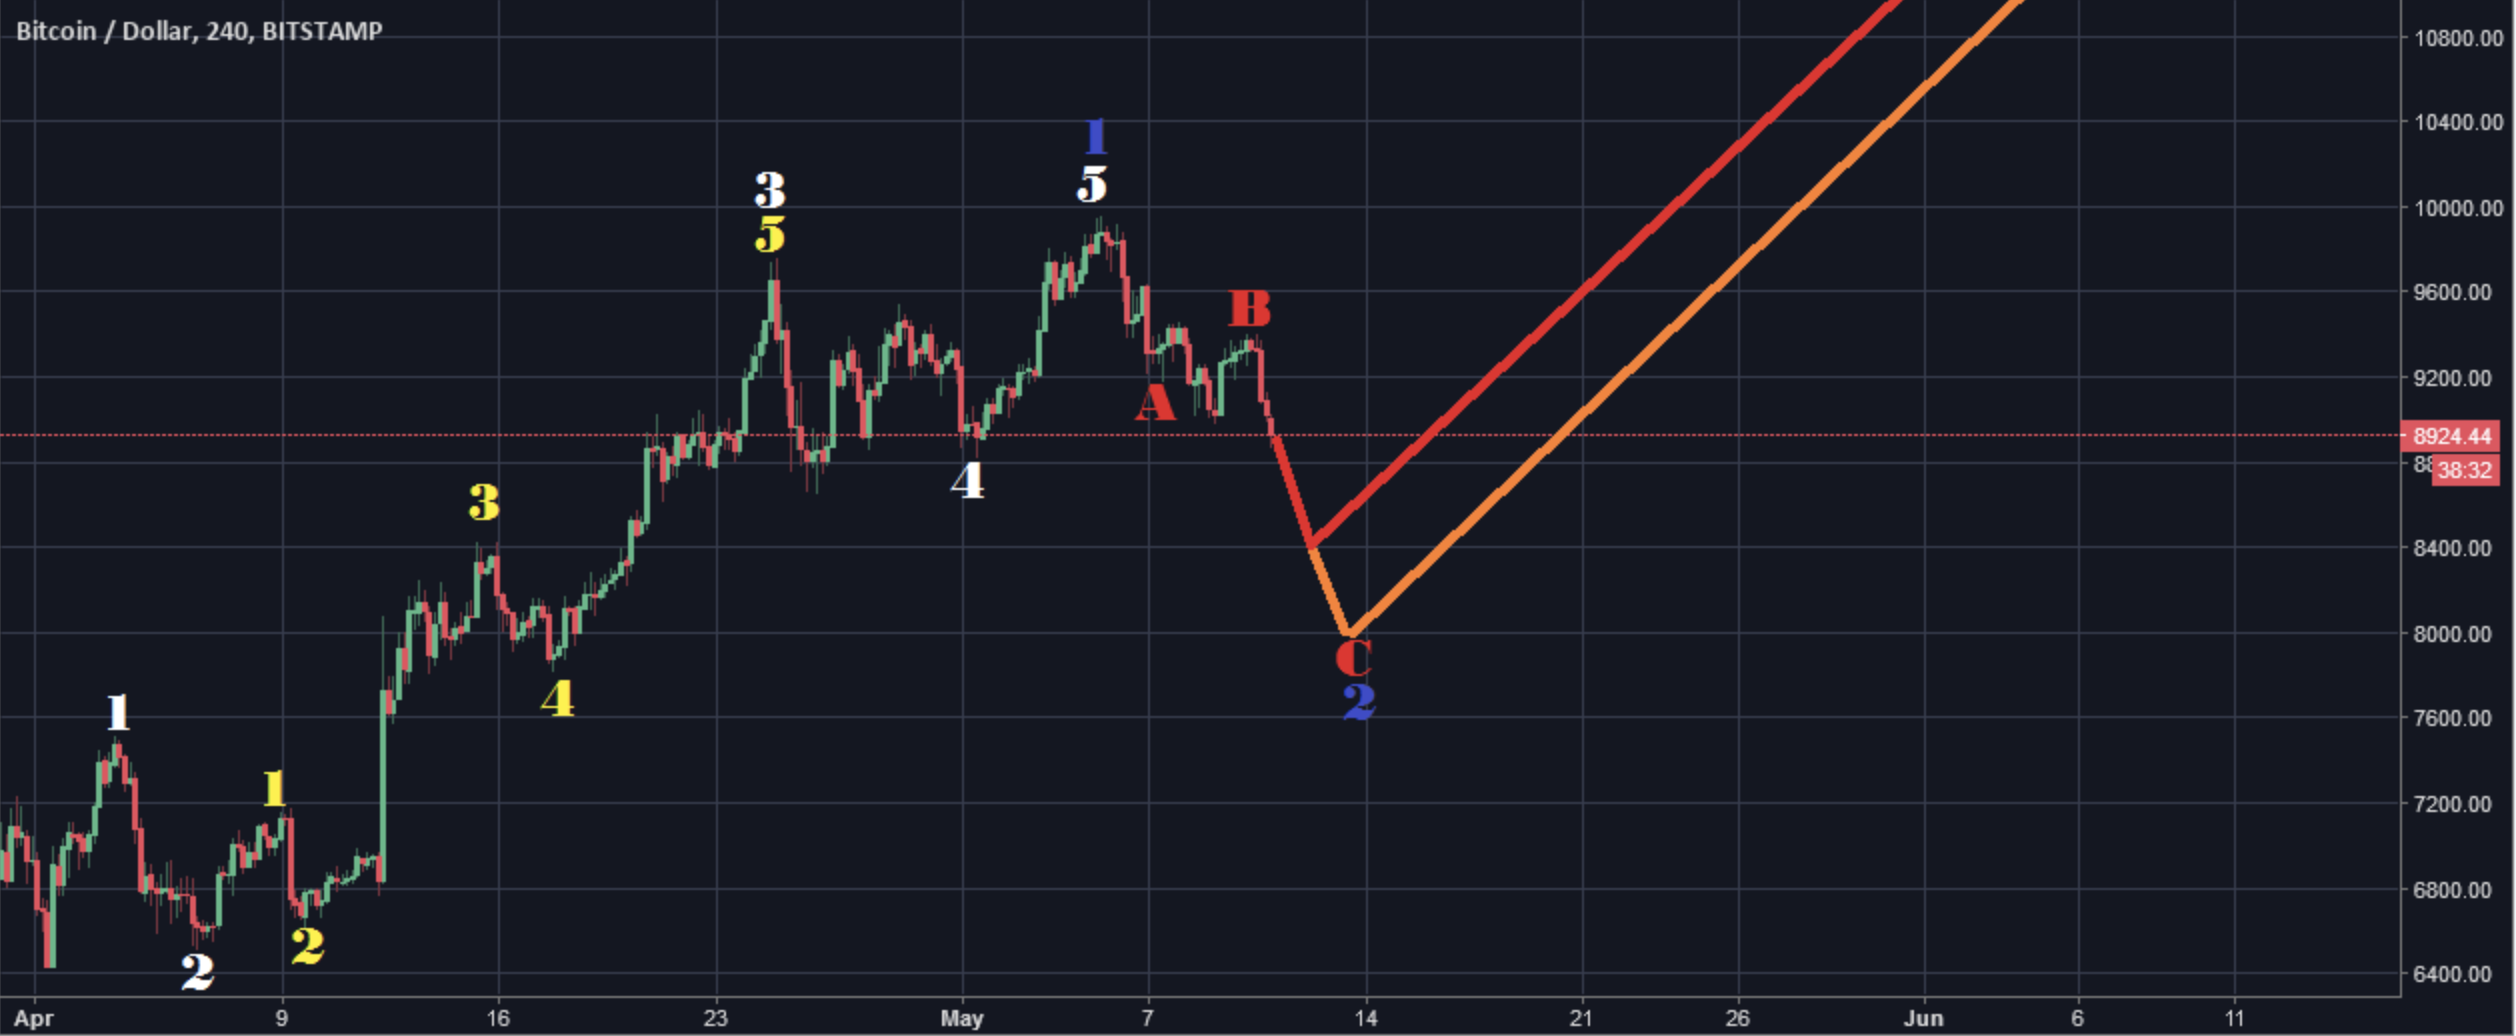
This morning the waves show a potential for blue wave 2 being in progress already! He sees us going down to the area of 8'400 - 8'000 and considers this a buy opportunity. For Wave 3 he sees a potential of minimum 14'000.
@lordoftruth:
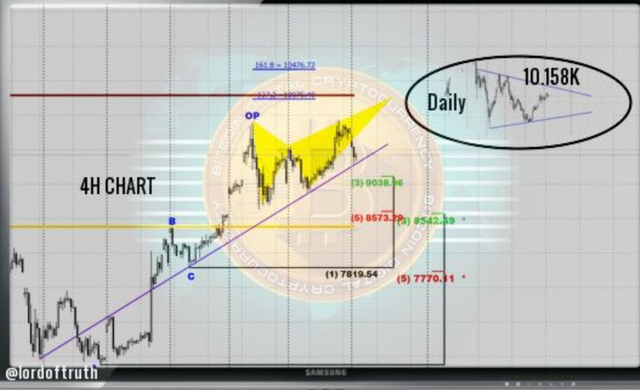
Since finding support at 8'200 bitcoin has regained 250. For rest of the weekend he expects further sideways activity.
If bitcoin moves below 8'367 (daily close) he expects 7'770.
If bitcoin moves above 8'643 (daily close) he expects that we see 9'460.
Todays trend is neutral. Expected trading for today is between 7'770 and 9'050.
@philakonesteemit:

We see a massive rejection at 10'000 range and have now hit a 0.618 golden ratio fibonacci retracement level. I do not believe it'll hold and we can see 9'050 to 9'150 range. If that doesn't hold we go for 8'200 to 8'620 range.
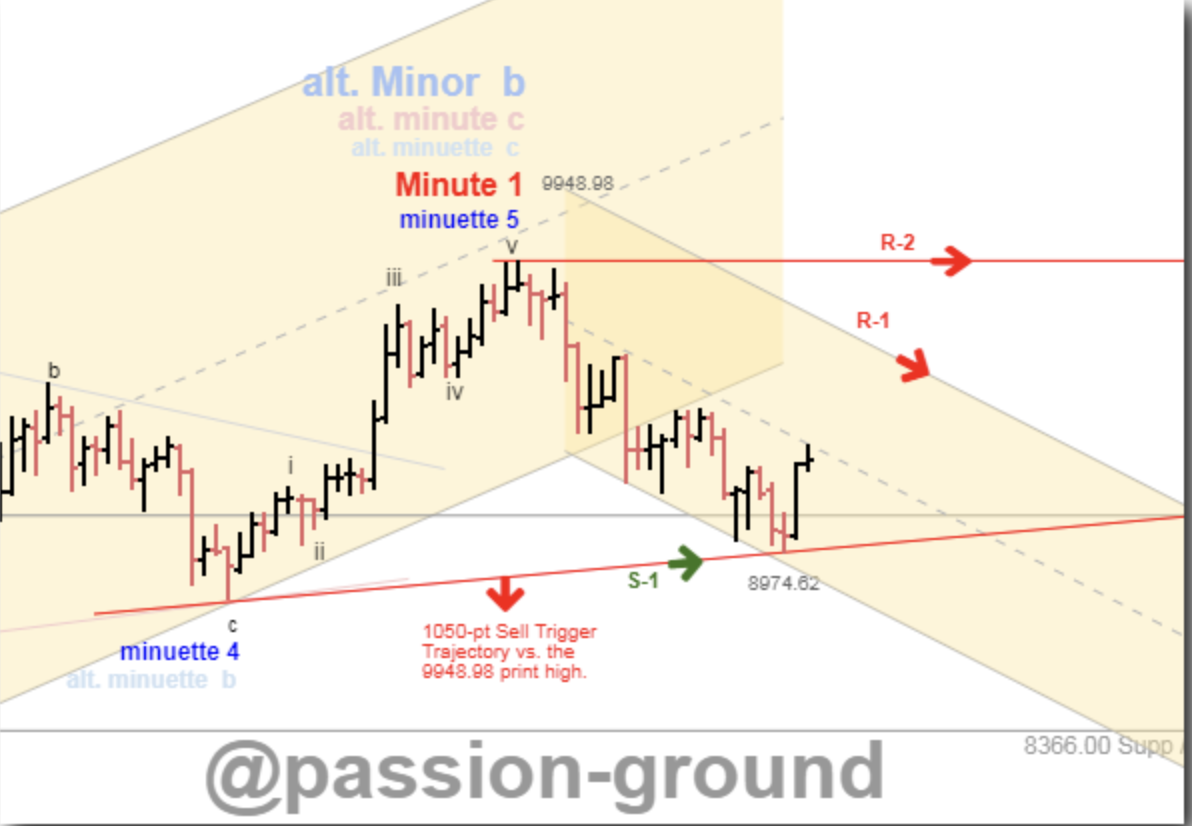
@passion-ground:
If the preferred bullish count is to remain in place, bitcoin could go down as low as 7'887, which is a 0.618 fib retracement of the entire bullish advance from lows printed on April 9th. Short-term trend is down, and the 9'577 level is “key” upside resistance. If crossed we will see a short-term move above the recent print high of 9'948. If 9'577 holds we will see further downside consolidation before next bullish run higher.
Summary of targets/support/resistance
Reference table
| analyst | latest content date | link to content for details |
|---|---|---|
| Tone Vays | 13. May | here |
| @haejin | 13. May | here |
| @ew-and-patterns | 11. May | here |
| @lordoftruth | 13. May | here |
| @philakonesteemit | 07. May | here |
| @passion-ground | 10. May | here |
Definition
- light blue highlighted = all content that changed since last update.
- sentiment = how in general the analysts see the current situation (bearish = lower prices more likely / bullish = higher prices more likely)
- target = the next (short term) price target an analysts mentions. This might be next day or in a few days. It might be that an analyst is bullish but sees a short term pull-back so giving nevertheless a lower (short term) target.
- support/res(istance) = Most significant support or resistances mentioned by the analysts. If those are breached a significant move to the upside or downside is expected.
- bottom = -> now renamed and moved to long term table. Low 2018
- low/top 2018 = what is the low or the top expected for 2018?
Further links for educational purposes:
- From @ToneVays: Learning trading
- From @philakonecrypto: Like in every post you find links to his amazing educational videos. For example here
- From @lordoftruth: Fibonacci Retracement
- From @haejin: Elliott Wave Counting Tutorial
*If you like me to add other analysts or add information please let me know in the comments.
@famunger u have sketch the predictions in vry good manner
famunger
If u dont mind please have a look on my stuff too
Love trading? Full into cryptoworld?
So, you should start use TradeCheck - best software for traders ever!
Description, support and download mirror there: cryptofications.com
Thanks for keep on going with these summaries @famunger, I still enjoy them :-)
Btw, do you have any experience with (margin) trading? I want to take a look at it since I don't know much about it and I think I should. I am looking for some beginners sources and best platform to start on.
I would stay away from margin trading unless you want to short or advanced trader. The market is still volatile to get nice moves of 20%+ trading without margin. Philakone has a good bitfinex margin tutorial though.
Thanks! I am not planning to get really into margin trading, but I would like to play around with a little bit of money just to get a better understanding of how it works :-)