BTC chart review, Oct 8th @ 10:00 PST
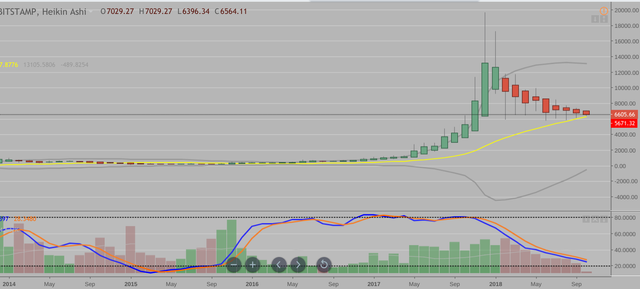
The monthly chart from the bitstamp exchange is still bearish based on the red heikin ashi bars.
The 20 month moving average is the yellow line which appears to be providing a support level at this time.
Stochastis are not on the steep decline and appear to be leveling off.
The bollinger band has also started to narrow in after the massive expansion due to the parabolic rise last year.
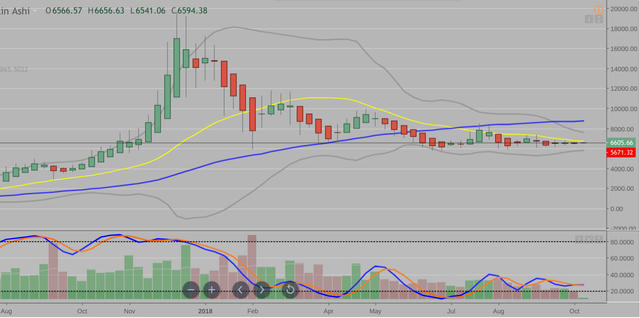
The weekly chart has price under both 20 wma (yellow) and the 50 wma (blue) for a bearish technical chart.
The 20 wma is also providing a resistance level which is clearly seen on the chart.
The bollinger band is very narrow and squeezing in on price. How long will it last? Price will definitely break either up or down at some point...
The daily chart is from coinbase, you can see the tight trading range that it has been in over the last few weeks.
Price is trading along the 50 dma.
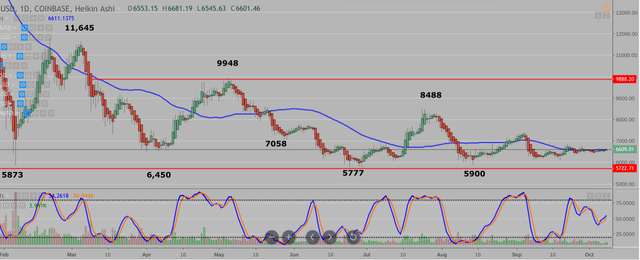
BTC has been in a consolidation range after the massive rise last year. It is not uncommon for assets to 'crash' after a parabolic rise and consolidate within a trading range for a while. IMO, it is a matter of time before it starts to rise again, it may be in 2019.............?