Bitcoin (BTC) Mid-Day Update: Head & Shoulders....Which Type?

SUMMARY
The fractal that was discussed during today's morning update is still in progress. The move thus far looks three wavish as an abc. The final C wave could be complete if the white 1,2,3,4,5 waves complete.

The primary count shows that the Right Shoulder (RS) could decline to $9,830 or so. IF the RS formation is in progress, then this remains bulish. The volume thus far remains confirmatory.

At a smaller degree of trend, there is a smaller Head & Shoulders top pattern in the works. This could bring prices to the $9,800 or so zone.

Legal Disclaimer: I am not a financial advisor nor is any content in this article presented as financial advice. The information provided in this blog post and any other posts that I make and any accompanying material is for informational purposes only. It should not be considered financial or investment advice of any kind. One should consult with a financial or investment professional to determine what may be best for your individual needs. Plain English: This is only my opinion, make of it what you wish. What does this mean? It means it's not advice nor recommendation to either buy or sell anything! It's only meant for use as informative or entertainment purposes.
Please consider reviewing these Tutorials on:
Elliott Wave Counting Tutorial #1
Elliott Wave Counting Tutorial #2
Elliott Wave Counting Tutorial #3
Laddering and Buy/Sell Setups.
Laddering Example with EOS
Tutorial on the use of Fibonacci & Elliott Waves
@haejin's Trading Nuggets
Essay: Is Technical Analysis a Quantum Event?
Follow me on Twitter for Real Time Alerts!!
Follow me on StockTwits for UpDates!!
--
--


I hope that the bigger image is uptrend
Below 10k one last time, i DIGG THAT
I found Bitcoins face in there I think, to keep up the good looks we'd not go much below $10k :)
@thedolphin
Lol! Interested to see if the broadening pattern plays out. What makes you select that?
I got this symmetric virus in the back of my head, and this looked probable to mirror 17-28 January :)
Oh sorry @berniesanders for answering a comment, did I hurt you?
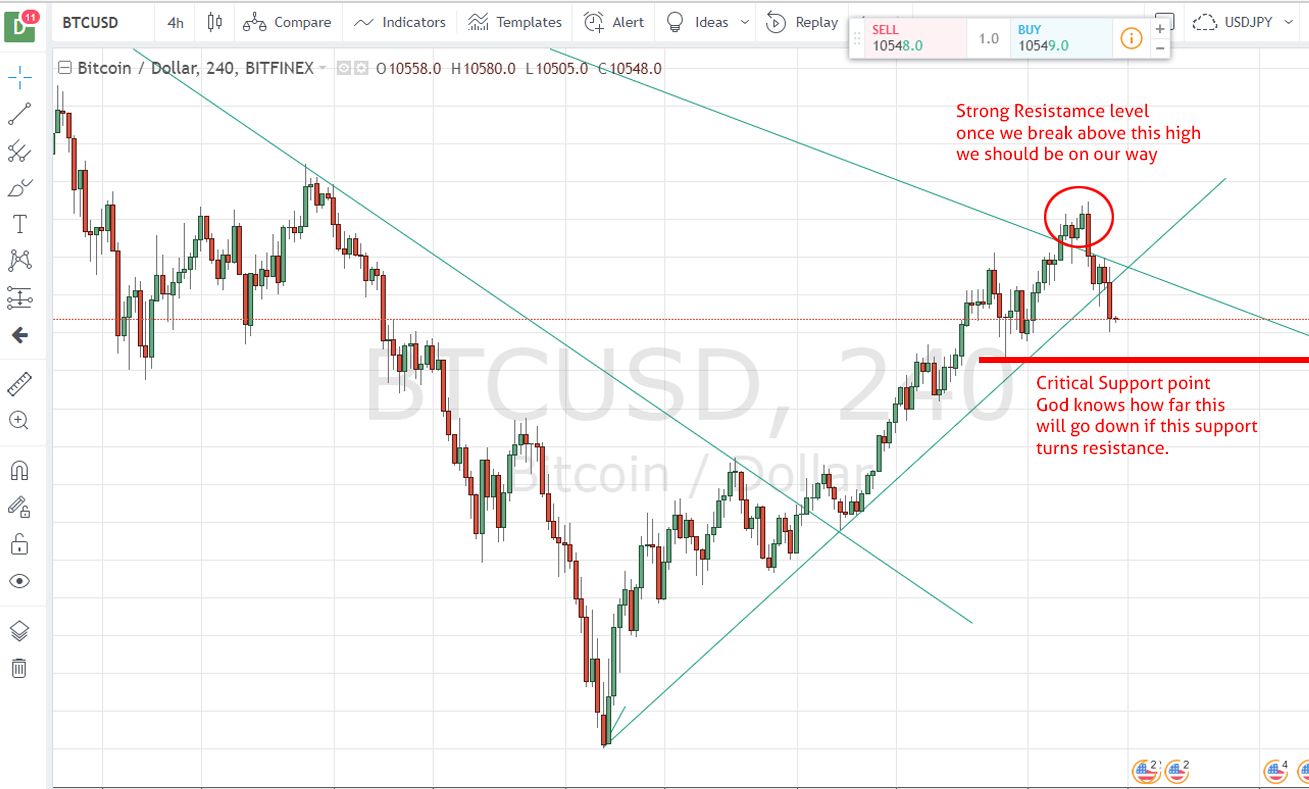
We need Bitcoin to break that previous high on the 4hr chart seen below if you look at my technical analysis you will see that this is biggest hurdle left for BTC to cross breaking the daily bearish trend line. I agree it could go as low as 8k if the support is broken.
We're in sync here. I'm surprised so many calling for huge dump now. Tape seems to show some strength and buyers.
The critical juncture was last night and still not yet resolved.
Nice post!
Keep it up=)
the type who however must also be sporty to receive it, because any way it's a business people should be appreciated
Thank you so much Haejin for sharing this good information with us ! I really admire you
Nice informative post.Lets see what happens.@haejin sir last time i commented on your post someone down voted me.Whatever happens i am always with you.@upvoted and resteemed.@haejin sir do you have any idea about international mother language day?If you don't then click on this link.You will like it for sure https://steemit.com/blog/@rupok/international-mother-language-day
.
if i like some ones view then what is the problem?
Cloud is who he is , an irritant
Thanks for these projections, but why no more videos?
Once it breaks that trendline it's to the moon. I hope it's the bullish head and shoulder. it made a few in the past few weeks. I hope it continues.