Golden Ratio Fibonacci Power - Is BTC topping out at 9k? Mathematics suggest yes!
From April of 2018 to November 2018, the Bitcoin price consolidated in what many people considered to be a basing pattern that signalled selling exhaustion. Commentators who had endured at that point, almost 11 months of bear market price action were convinced that the 6k level would be the bottom and that the market would soon turn around - that it did, but not before an absolutely punishing sell off which resulted in the price of Bitcoin falling almost 50% from the 6k level before putting in a bottom and eventually making a real reversal.
Today's piece is not about history as it was written or printed, we have the price charts to recount this particularly difficult time for crypto. It is about the excellent power of Fibonacci retracements and how they played a "pivotal" role in guiding price action all the way down, and again, in 2019.
Now, I won't bore you with what Fibonacci retracements are, you have investopedia for that, but I will steer your attention towards one particular ratio, and that is the 61.8% or 0.618 Fib.
Known in mathematics as the "Golden Ratio", it is defined as :
The Golden Ratio is such that the ratio of two quantities is the same as the ratio of their sum to the larger of the two quantities
Algebraically :

This ratio has identified in a plethora of natural occurrences and is even said to be the golden ratio of god. In-fact, it's importance is understated in a myriad of applications, from Architecture to Biology, Music to Finance. And as of 2010, it's importance has parlayed into the Technical Analysis of Bitcoin. Not to say that it wasn't used in TA before, but it's staggering occurrence in the Bitcoin Price Action is something to be marvelled at, and worth a second look.
Calling the highs of three major 2018 rallies
In the beginning of February 2018, coming off the all time high, Bitcoin had it's first capitulation move resulting in the price of Bitcoin falling to just under 6k. It then proceeded to have a monstrous rally to ~11,780 forming it's first major lower local high. Those of you who spotted the change in trend would have caught the weekly lower swing high, and lower low and noted that on the macro scale, we had entered a bear market.
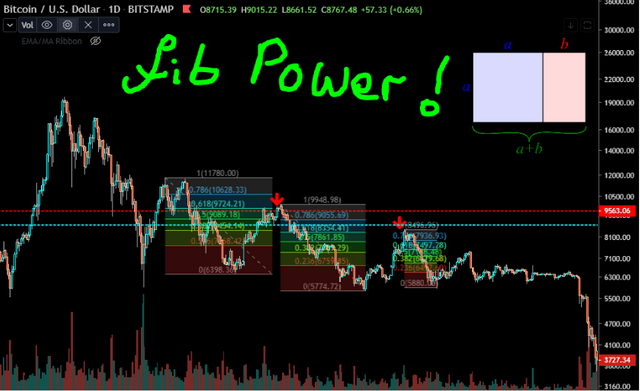
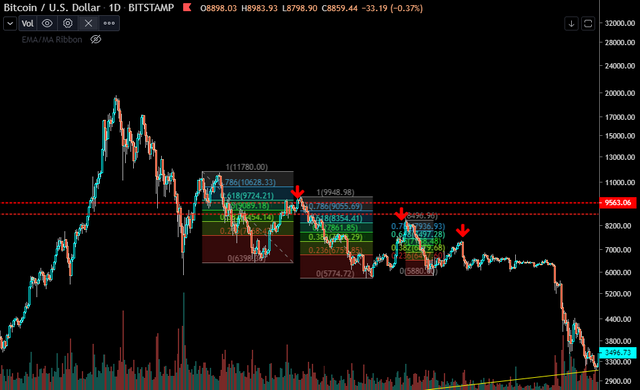
Taking the fib from the high (11,780) to the low which followed (6398), we get a 0.618 fib of 9724. The first red arrow marks the top of the subsequent rally (9948). While not perfect, the 0.618 level proved to be the final blow before another voracious drop back to the base of the range at 5774.
What happens if we take the fib from top (9948) to bottom (5774)? We get a 0.618 fib of 8354. Guess what, the next rally hits a high of 8496, and again, the 0.618 level proved to be the ultimate resistance leading the price back down to 5880.
By this point, you could have guessed, what if we took the fib of the top of that rally (8496) to the bottom (5880)? The 0.618 is 7497 and we should hit that on the next rally? Well not quite, only 7400, but again, the 0.618 fib proved to be a very critical level.
How the 2019 top was called
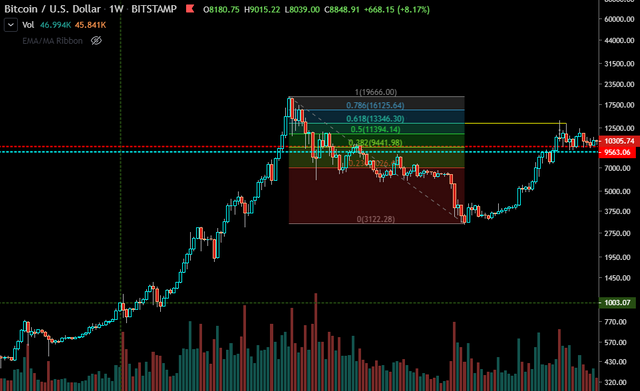
So 2018 proved to be very pivotal for the 0.618 fib level. What about performing the same on a larger time scale? How about we take the fib from the all time high (19666) to the low (3122) and see if that works too? We get a 0.618 fib level of 13346.
Well, what do you know, we rallied to that level on the 24th of June 2019 and it also marked the high for that year. When everyone was calling for new all time highs, and a Bitcoin lunar landing, I was absolutely convinced we had topped out. After-all, a trend is your friend until the end of the trend right? And up till now, we've seen the 0.618 fib mark the highs of every major relief rally in this bear market up till now. It would be more than a reasonable edge to play moving forwards.
What about 2020?
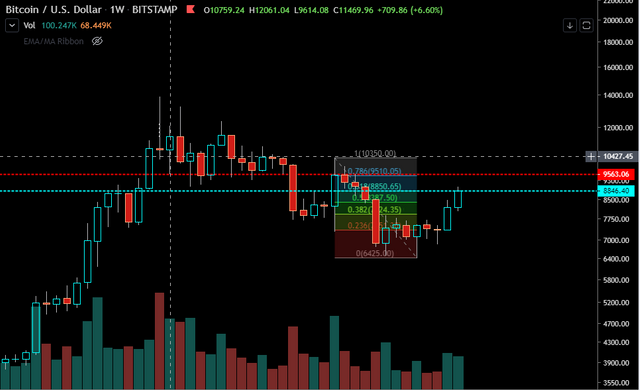
Taking the fib from the most recent weekly swing high (10350) to the most recent swing low (6425) and marking the 0.618 fib level, we get 8850. It's scary how accurate this might turn out to be if price stalls here and returns to the base of the range.
There are many other indicators and analyses to suggest that we may have topped out for this rally. That isn't the scope of this post since we're focusing on the 0.618 fib, but often nature works in confluent ways and if by weekly close we are below 8850, you can bet i'll be short.
Hope you enjoyed the insight.
Remember, I am not telling you to short right now. Take what you will from this post, these are my own ideas and thoughts. I am not your financial adviser.
Congratulations @holdo! You have completed the following achievement on the Steem blockchain and have been rewarded with new badge(s) :
You can view your badges on your Steem Board and compare to others on the Steem Ranking
If you no longer want to receive notifications, reply to this comment with the word
STOPVote for @Steemitboard as a witness to get one more award and increased upvotes!
Congratulations @holdo! You received a personal award!
You can view your badges on your Steem Board and compare to others on the Steem Ranking
Do not miss the last post from @steemitboard:
Vote for @Steemitboard as a witness to get one more award and increased upvotes!
To listen to the audio version of this article click on the play image.
Brought to you by @tts. If you find it useful please consider upvoting this reply.