Bearish trend is the best time to sort the wheat from the chaff and find really reliable assets. Learnhowtodoithere
I will find out how relevant and efficient the filter is and explain the main rules and regularities.
Today, it is going to be a quite unusual post, as I’d like to suggest an analysis of not a single altcoin, but about 90 percent of cryptocurrencies, which are now present in the market.
This idea was suggested by my yesterday’s comparative analysis of EOS and ETH (see here) and one of educational articles (see HLEMA strategy). It is based on superficial analysis of altcoins, compared with the cryptocurrency benchmark Bitcoin, and division the cryptocurrencies into two groups: investment-appealing coins and those that are not worth buying.
This analysis is very easy to conduct and I think it to be the crucial moment, especially for beginners, as they will be able to avoid the mistakes that may result in huge losses in future.
Well, let’s analyze altcoins in order to learn how to cut the risks of a wrong purchase/sale of a cryptocurrency asset.
I’ll start with a tricky question. What do Monero and Litecoin have in common?
I can say right away, there is no point in comparing the teams, block-sizes or the network congestion.
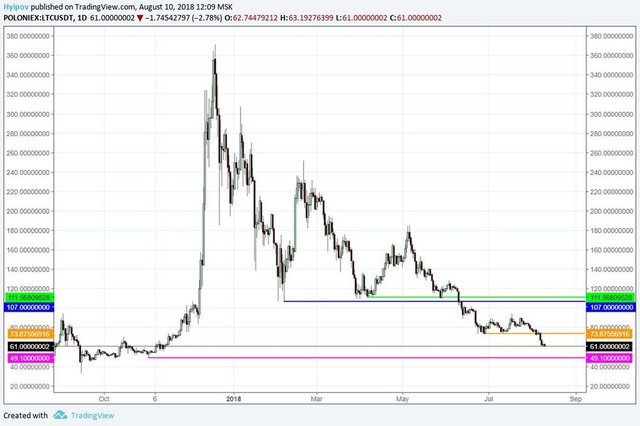
Look at Litecoin price chart:
Now – at Monero price chart:
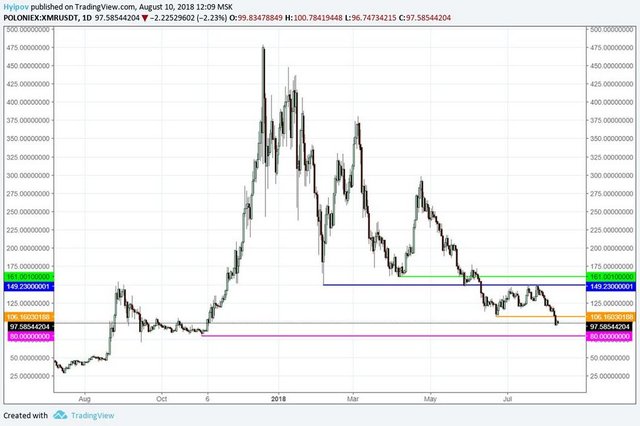
If you compare these two charts above, the similarity is clear. But the most important, we should pay attention to, is the local lows, to be more precise, they location relative to each other.
You see, there four clear lows in the price charts of these two cryptocurrencies. The very first one is the local summer low (orange line), the next low is the April’s bottom (green line), the next is the price drop in February (blue line) and November 2017, when all cryptocurrencies were sleeping before the rally in spring (purple line).
You can change the lines’ colours, it is only important that you see and understand the picture.
So, as I’ve said, these two assets (Monero and Litecoin) have very similar price charts, but the main similarity, is the location of low in relation to each other. It is the order of lows in the chart that allows identifying investment prospects of an altcoin and including it a certain group of coins.
We have a kind of credibility filter for cryptocurrencies that is based on two simple trading laws, which, I hope, nobody has doubts in.
Law 1: a broken out support level always becomes the future resistance level; and the broken out resistance level will always be the support level in future.
Law 2: the better an asset seems, compared with the market, the more buyers are interested in this instrument; and vice versa, the worse the asset looks, the fewer buyers are interested in this instrument.
These two rules seem obvious. However, for those, who have just started trading cryptocurrency or any other financial instrument, I’ll give some explanation.
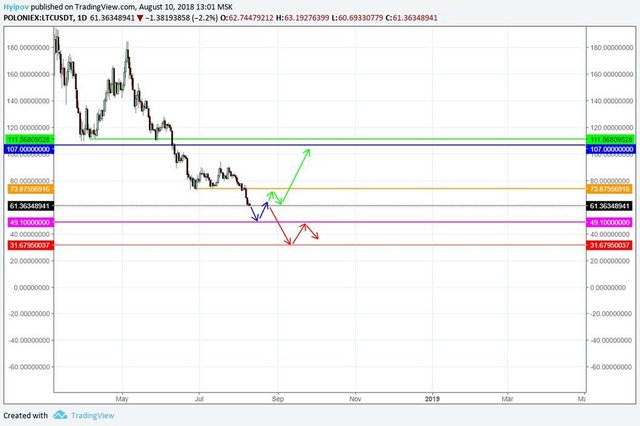
In Litecoin 1D chart, there is a descending movement (bearish trend) for LTCUSD.
As you see, Litecoin price broke through the summer support level and dropped below the orange line. From below, the price move is limited by the level that I’ve marked as the low of November, 2017 (purple line); it will be the support level for the price chart. Once the price approaches the level, it is likely to rebound and go up.
When the price rolls back, the law 1 works and the broken out orange level will turn into the resistance and won’t let the ticker easily move on (see green arrows).
The same will be if the ticker breaks through purple line, the support dated November. If so, the broken out level will create a strong barrier to the ticker when it tries to regain the positions and go back to the starting point.
Therefore, taking this law into account, I understand that the most interesting is the asset, whose price chart has the most numerous support levels below and the least numerous resistances above.
To study the second law in detail, you just need to understand a simple fundamental thing. The piece chart in the screen results from trading between buyers and sellers.
Many beginners, as wells as not beginners, often confuse the action with the result and say that the chart directs buyers and sellers...which completely wrong.
Here is BTCUSD one-day chart with its yearly history:
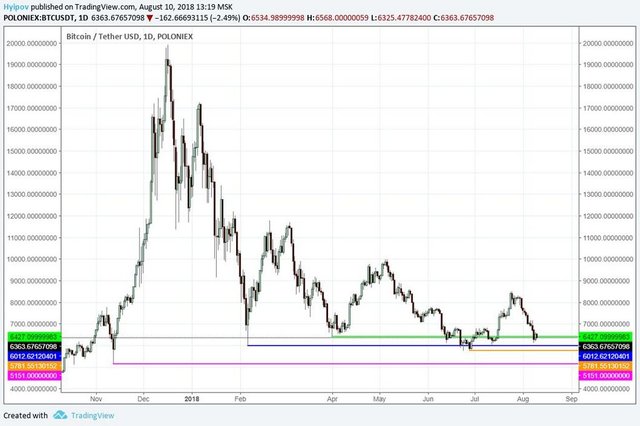
The same BTCUSD one-day chart, zoomed in:
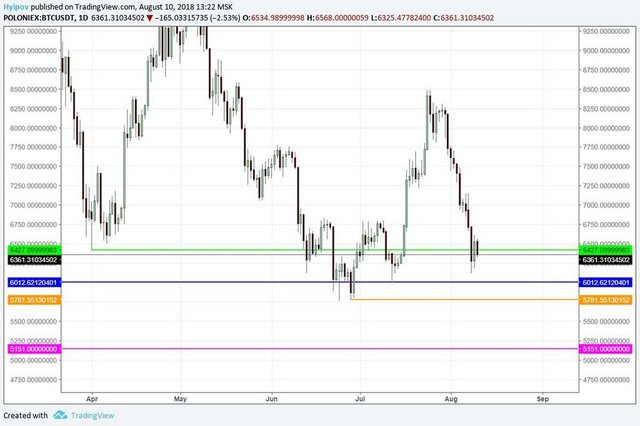
If you mark the above levels in the BTCUSD price chart and analyze the ticker’s location, relative to the present key levels, you’ll see that the price hasn’t broken through the latest support level, emerged in June; moreover, the other support levels haven’t been broken through too.
It is clear that BTCUSD has just penetrated the spring, green, level, but hasn’t went on lower.
Now, look at LTCUSD one-day chart, zoomed in:

If you compare the BTC USD situation with that of LTC USD, you’ll see that the Litecoin cryptocurrency is performing worse than the market.
From the point of view of trading psychology, it means that buyers have little interest in Litecoin, and so, sellers, trying to sell the asset, according to the general market pressure, don’t find any demand for their Litecoins. It makes them reduce the sell prices (ask) until there is a buyer. As a result, there is the price drop in the chart.
This buyer weakness may result from many reasons; I enumerate the most common one below:
No big traders for the asset (diversification of risks/portfolio, exiting the market, expecting a suitable price);
Manipulations by big traders in order to press the market as low as possible, following the general trend;
Fundamental and inside factors of the asset that make buyers cancel purchases/start selling.
Of course, it is not the complete list, but in any case, this situation doesn’t suggest anything positive, and so, the asset is bears little interest for investment, and one should avoid buying it.
That is all for today. Next time, I’ll go on describing the way to identify promising assets, in the investment terms. I’m going to mark the key levels for altcoins to Bitcoin and find out which one is really worth buying.
I wish you good luck and good profits!
PS. If you agree with the forecast write “+” in the comments, if you don’t agree, put “-”. If you liked the post, just write thank you, and don’t forget to share the post with your friends. It is easy for you and I will be very pleased :)
Stay informed on the latest cryptocurrency news, follow my posts in the blog.
Useful links:
I recommend trying to trade with a reliable broker here. The system allows you to trade by yourself or copy successful traders from all across the globe.
Telegram channel with high-quality analytics, Forex reviews, training articles, and other useful things for traders https://t.me/cryptonews123.
)


Right thoughts you have @hyipi, and set them cool
Congratulations @hyipi! You have completed the following achievement on Steemit and have been rewarded with new badge(s) :
Click on the badge to view your Board of Honor.
If you no longer want to receive notifications, reply to this comment with the word
STOP