Bitcoin Price Analysis August 9th
Bitcoin Price Analysis
August 9th, 2018
Join our trading community on Discord!
TD Analysis
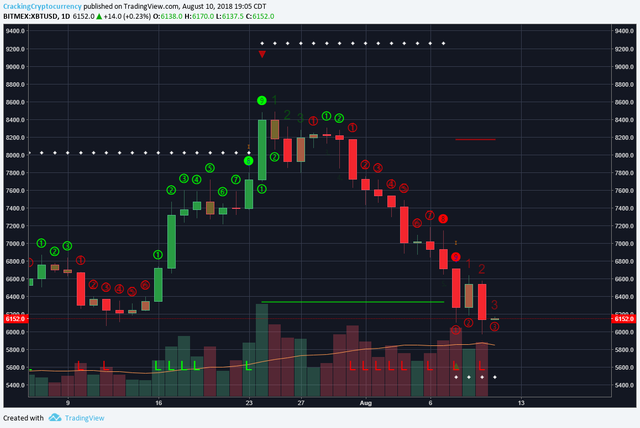
TD analysis gives us added faith in our system of analysis.
We can see that the green nine count led to the turn around (read: sell-off) recently, and if we look further back in the chart we can see the same thing with a red nine predicting the surge in price to above 8k.
So we've now currently hit a red nine several days ago. We can see that price has ranged from a wick slightly below the red nine's low to slightly below it's top.
TD theory would give us two possible routes ahead of us based on the information currently available to us just using setup and countdown data.
Scenario #1
The red nine predicts the reversal and price begins an uptick at this point. Support around the psychological number of 6k lends credence to this, as does any cursory glance at order books positioned around the 6k price tag.
Suggested Action:
Speculative bids placed slightly below 6k and slightly above (1-2% variance in current price). A green two trading above a green one would allow us to offload our bet at profit in anticipation of a re-test of support or a movement towards a nine count to the upside. Offloading 25% of your position upon a close of a green two above a green one would be recommended, and if the downturn occurs we unload the rest of our bag. If however it continues on the upward climb, we hold our remaining position until further news presents itself.
Scenario #2:
The completed buy setup leads to a buy countdown, and we see a break not only of the true low of the red nine but a further violent move downwards to complete a 13 buy countdown. Confirmation of this will occur upon consistent trading of reds below it's prior number. Such as a red two trading below a red three, or a red three trading below a red two. Although this is what we currently see, it foreshadows no real price movement downwards because the current buy orders are keeping the price fairly stable. We need to see a more pronounced movement downwards before this scenario is confirmed.
Suggested Action
Wait for confirmation of a price break below our current trading range, and then wait patiently for your entry for the TD countdown or other indicators to give us clearer visuals.
Ichimoku Cloud Analysis
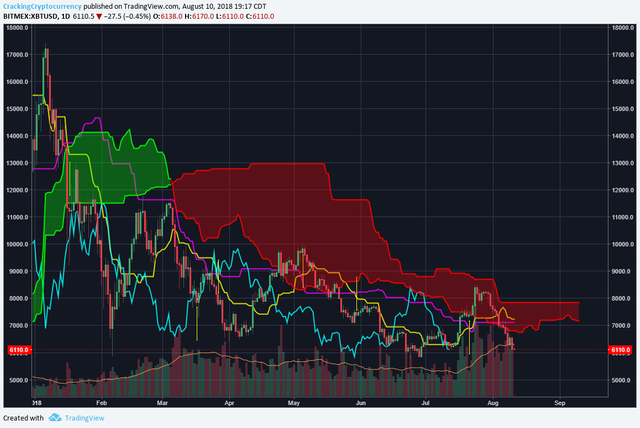
The Ichimoku Cloud Indicator gives us an interesting takeaway from the current trading environment. Price rallied to test the top of the Senkou Span A, trying to break free of the cloud in totality and transform our Span into green, which is always a good sign and we have many trading strategies that revolve around price trading above the cloud.
The Tenken is holding still above the Kijun line, meaning we don't have the indication of a negative TK Crossover.
We also see the cloud curling up slightly, which is a positive sign.
However, the truly germane information provided by an anlysis of the cloud is something that might be overlooked by those looking for intense analysis of it's revelations. That is the contraction of the cloud. Look at how beautifully it maps the price range contraction. If you look at the chart without any overlays it's easy to see the width of the price range following the initial movement from 19k down to 6k. That's a 13k variation in price. Following, we moved recovered to 11,600 and fell back to 6,500. This is a variance of slightly more than 5k. Finally, we've recovered to 9,800 before falling to 5.5k. This latest movement is from 8.5k to our current price. I've just illustrated the rapidly contracting price ranging. We can see this mapped by the tightening of the Ichi cloud. Price contraction in this vein leads violent movement one way or the other.
On a personal note, it's great to be back! For those who follow my content and the content of Cracking Crypo you've noticed I've taken a hiatus. It seems as if 95% of those who posted Cryptocurrency related content chose the exact time to also take a vacation (read: after BTC crashed from the ATH). However, this wasn't the case with me. I was offered an amazing opportunity in employment in the real world, and that has due to circumstances outside my control ended at the current time. So I'm back to doing what I love, trading, analyzing charts, and providing the best content I'm capable of to you wonderful people. So great to be back, look forward to profiting with all of you!
Join our trading community on Discord!
I'm not a financial adviser. The information here is for education purposes. Trading and investing are wonderful things to do, and it's OK to take advice and to learn. I'm glad you're here right now reading this, educating yourself. Don't take my word as the gospel, and be careful. All investment and trading opportunities carry risk, I'm sure you reading this have the potential in you to profit from a careful trading plan, and wise investment choices. Do it right, do your research, and don't trade stupid. Very best of luck to you!.