What goes up, must come down
Bitcoin's prior price history vs. drawdown percentages:
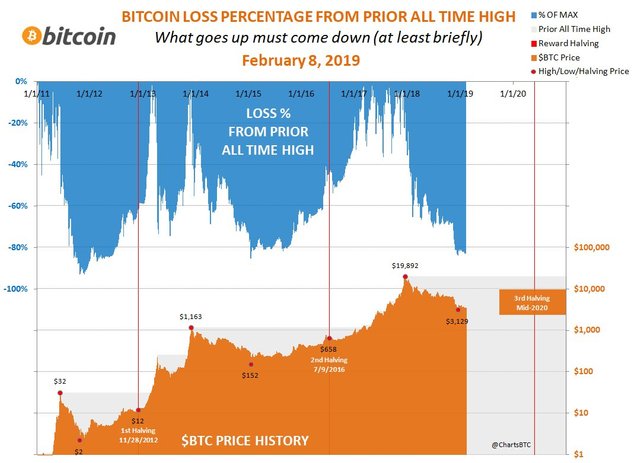
(Source: https://twitter.com/ChartsBtc/status/1093913570411044865)
As you can see after each major bull run there was an almost equally destructive draw down.
The halving events are also plotted on the chart.
As you can see the price tends to bottom and start moving up roughly 12-15 months prior to the halving event.
We are right around 15 months away right now from the next one.
That means what we are seeing today could be the start of the next move up.
Fingers crossed.
To the Moon 🌚
Good chart it seems like most of the increase comes after the fact and delayed by a month or two before the market starts to feel it.
Yep, though I think there is about a 300% increase one year prior as well.