Bitcoin Price Movement Analysis
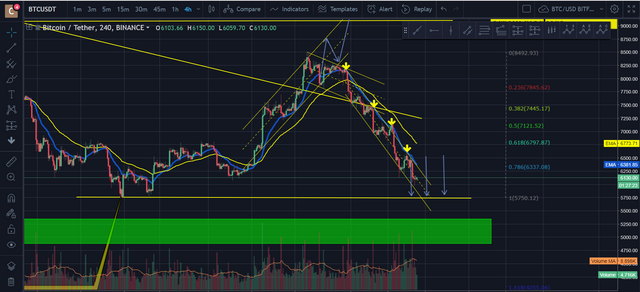
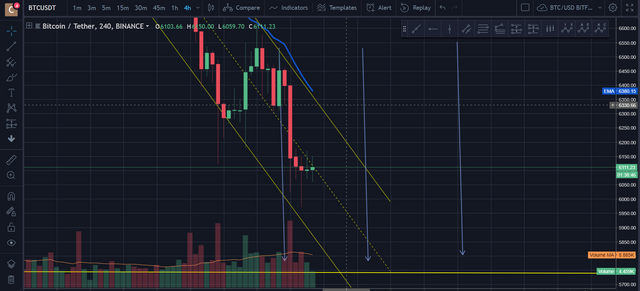
Bitcoin is having a hard time crossing the mid-line resistance of the channel formed, which is evident from the long wicks in the upside direction. If it is successful in crossing it, Bitcoin can jump to $6300-$6500, where it meets resistance line of 21 days EMA(blue colored line). Otherwise, we go down to prior low of $5900-$5750 levels.
Positives
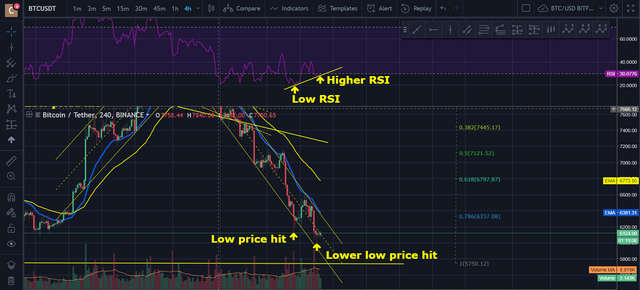
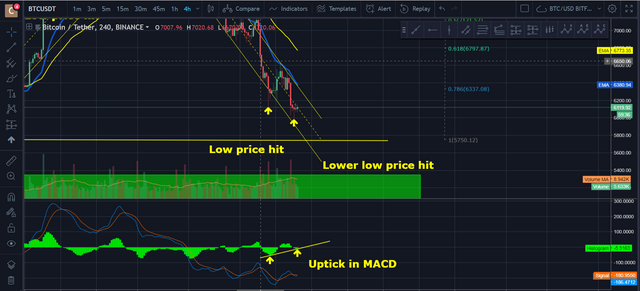
We have uptrend in RSI and uptick in MACD, which indicates some upward price movement in Bitcoin.
I think it will reach to 5900$
Personally, I think by the end of the month, it will be $5k.
The key right now is to actively trade to increase the amount of BTC you have. I expect in September, it will start rising and will continue through December.
Its all about probability.
And risk management.
August is historically brutal on BTC.