Bitcoin Trend Series / EP. 610 / Large Butterfly "Buy"
Time: 8.25 A.M. / GM+2 / 1st June 2018 – Fri.
Bitcoin price stalled below the 9.990K in early May and has been steadily returning towards 2018 lows, and continues to Fluctuate Around EMA50.
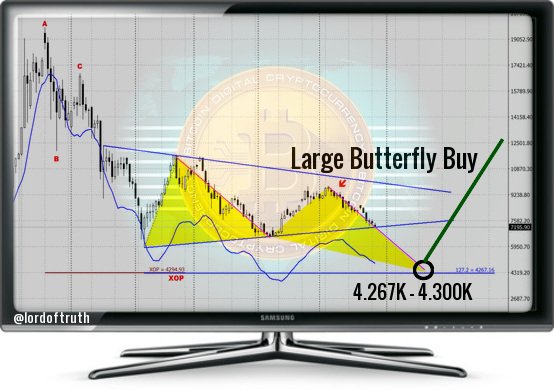
There are no change to our bearish scenario, unless breaching 7.910K, and we still suggest surpassing 7.100K - 7.210K towards 6.519K - 5.878K - 4.300K, to get the Large Butterfly "Buy" shown on the below daily chart. The reason why we believe, Long Term Traders Should Wait The Area 4.267K - 4.300K as potential bullish reversal.
If the price breaks the 7.614K barrier, it could easily rally towards 7.910K level, before any new decline but will not cancel our Bearish Scenario.
Venezuelan Government subsidizes all electricity in the country and anyone using this resource to mine Bitcoin has become a target for legal repercussions, the reason why various mining operations have been shut down.
US dollar is on weaker footing owing the resurfacing Trade War Fears, with the government imposing higher tariffs on steel and aluminum imports from Mexico, Canada.
If you take a look, we can see that February was bullish, March was bearish, April was bullish and May was bearish. June is near,Will The Cycles Continue!! Yes, a reversal may occur but not before testing the new low of 2018.
In our previous post / 609 / we had forecast the trading range will be between 6.915K and 7.614K. The intraday high was 7.599K and the low was 7.340K.
At press time, bitcoin is trading around 7.475K and the chances is still valid to achieve more decline to extend losses to reach 6.519K - 5.878K - 4.300K as long as the price Below 7.910K.
The 2 weekly bearish stop grabbers after breaking 7.614K, suggest drop below 6.519K, to test 5.878K reaching 4.300 area, the Same Destination point of the Butterfly "Buy".
We will suggest / Bearish Trend / for today.
Support 1: 6519.000 level.
Resistance1 : 7614.00 level.
Support 2: 5878.000 level.
Resistance2 : 7910.000 level.
Expected trading for today:
is between 6915.00 and 7910.00.
Expected trend for today :
Bearish.
Medium Term:
Neutral.
Long Term:
Bullish.
The low of 2018:
5947.00 !!! / 4300.00 Expected.
The high of 2018 (BitcoinTrader's Year):
14469.00 / Expected.
The low of 2019: ???
The high of 2019 (Bitcoin Holder's Year):
36000.00 level / Expected.

investing considerable time and effort up front in
hopes of considerable returns down the road.
I'm so proud of my little blog, and so grateful to all of you
for support to keep it going.

thank you, what is the blue line indicator? Is it ema 50?
thank you........the post very important
teacher please let me know the answer..
To listen to the audio version of this article click on the play image.

Brought to you by @tts. If you find it useful please consider upvoting this reply.
This post has received a 7.13 % upvote from @booster thanks to: @lordoftruth.
too many bull traps already i hope we don't for one more
Thank you @lordoftruth for everything you do for the community. Just posted today's Bitcoin Technical Analysis ANALYSTS DAILY SUMMARY.
Go check it out and give us an upvote, resteem, follow please.
I want you to recommend the best software to check cryptocurrency status in real time - https://masscoinapp.com/