Bitcoin Trend Series / EP. 672 / Waiting For Solid Fundamentals!
Time: 8.32 A.M. / GM+2 / 13th Aug 2018 – Mon.
Recapitulatin
Technically our major weekly target stands at 4.444K, the butterfly target, that we've mentioned in our post / 648 / !
Fundamentally, we've estimated that Bitcoin Breakeven Mining Expense stands around 5782$/BTC, in our post / 653 / !
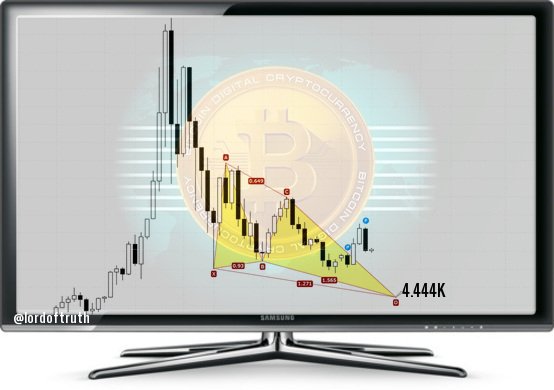
For now, the Fundamental Background remains the main driver for bitcoin market. It means that the 5.782K level is the Fundamental Barrier, the reason why we believe that bitcoin price will be difficult to test 4.444K !
But if Bears Can Manage To Fight Harder, then the things will be tough, as if the price Technically Break 5.782K, bitcoin price will test 4.444K as on the above weekly chart but the price hardly will hold below the fundamental barrier For Too Long !
Market Factors
- Bitcoin market is waiting for Solid Fundamentals, as news or even rumors of approval by the SEC, would definitely jump start reversal of last week’s losses. On the reverse side, a rejection would have an opposite effect dumping prices to new lows.
Technical
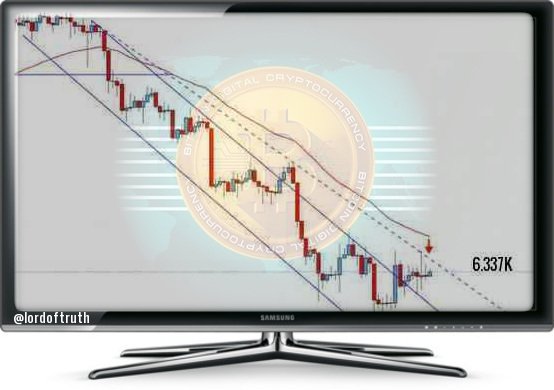
In our previous post / 671 / we had forecast the trading range will be between 5.872K & 6.510K. The intraday low was 6.190K and the high was 6.499K.
Bitcoin price have been showed some bullish bias but still traded in the Bearish Channel on 4H shown below, the reason why we think, bitcoin price will keep looking for another bottom for some time and the bears will manage to push the price down to its previous low at 5.872K.
Stochastic enters the overbought areas, EMA50 forms continuous negative pressure, and Oscillators reflects selling pressure could return.
Note; Breaking 5.872K will extend the losses to 5.500K.
Sentiment
current spot prices and 6.800K.
Support 1: 6039.000 level.
Resistance1 : 6510.00 level.
Support 2: 5782.000 level.
Resistance2 : 6800.000 level.
Expected trading for today:
is between 5782.00 and 6510.00.
Expected trend for today :
Bearish.
Medium Term:
Neutral.
Long Term:
Bullish.
The low of 2018:
5782.00 / Fundamental Barrier / Done.
4444.00 / Technical Barrier / Expected!
The high of 2018:
11700.00 / Expected!
The low of 2019:
6600.00 / Expected!
The high of 2019:
25000.00 / Expected!

investing considerable time and effort up front in
hopes of considerable returns down the road.
I'm so proud of my little blog, and so grateful to all of you
for support to keep it going.

Looks like we have a short-term bullish divergence with RSI and MACD.
As always, thank you for this useful information @lordoftruth
Congratulations @lordoftruth! You have completed the following achievement on Steemit and have been rewarded with new badge(s) :
Click on the badge to view your Board of Honor.
If you no longer want to receive notifications, reply to this comment with the word
STOPa slight pull back from touching the high still the picture is unclear where the market is pulling off too