Bitcoin Brief with Tone Vays,Technical analysis summary. *18/09/18
All credit to Tone Vays and his crew that has played a significant role in my understanding of what bitcoin and the block chain is. This summary is my perspective based on the technical analysis Tone does in his video linked below. Follow him for regular updates in topics relating to price, law, and fundamentals of bitcoin and the block chain.
Tone advises bitcoin traders but does not trade it himself, he considers himself an investor that accumulates bitcoin over the long run.
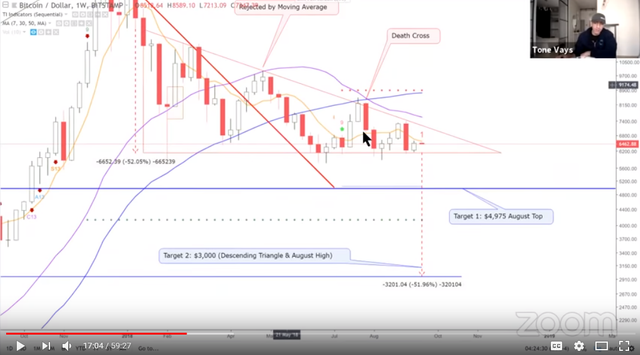
The monthly chart is still on the same downtrend since January, where bitcoin saw a high of $20,000 the month before, and seems to be heading for the same bearish pattern it had back in 2014, currently failing back to the support at around $6000. The thirty-month moving average is going to increase its rate of rising, approaching $4800, where another line of support from last year’s breakout is waiting to keep the price up.
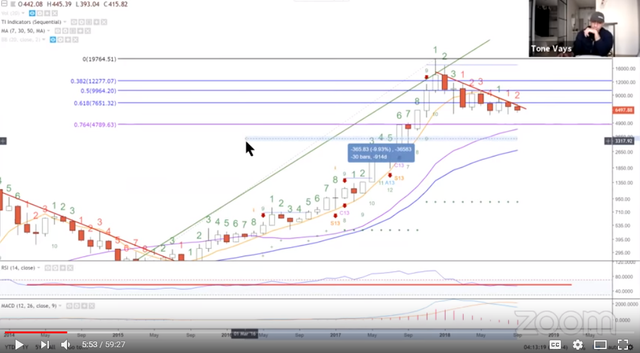
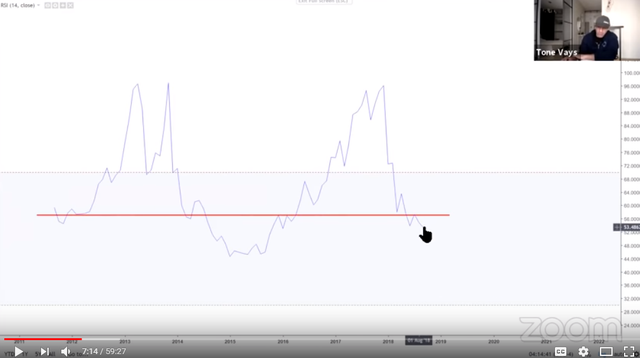
The RSI made a new all-time low, trading below a lower low for the second time below the medium and also seems to be repeating the trend back in 2014 that indicated the beginning of the fall out.
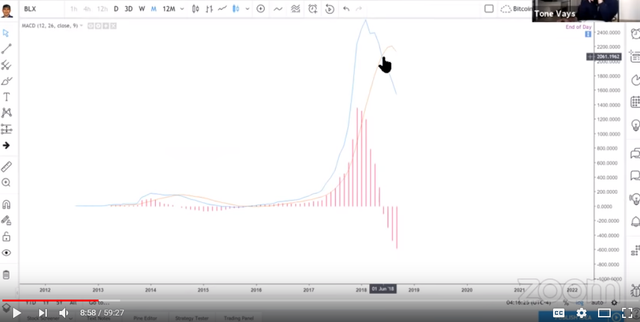
The MACD flipped to the downside again in June of this year, the previous time this happened was in July of 2014, also lining up with the similarity of the 2014 bear market.
On the weekly chart the middle Bollinger band (the twenty-week moving average) is coming down quickly and should accelerate as previous high candles get knocked out. This has rejected the price four times this year already and could allow another dead cat bounce to $7000 before rejecting it again.
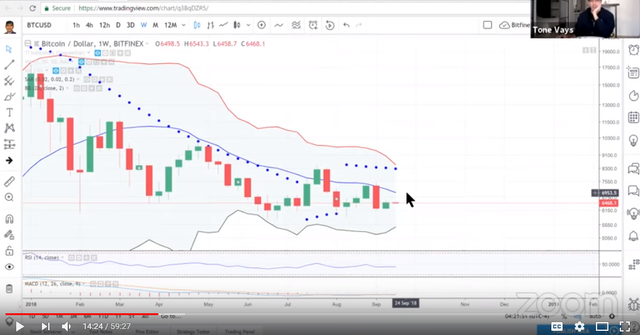
The very clear descending triangle that has been forming this year indicates a high probability for a breakout to the downside with a target at $3000, if the price falls below the $4800 resistance. The thirty- and fifty-week moving averages are still looming over the price and is on their way down.
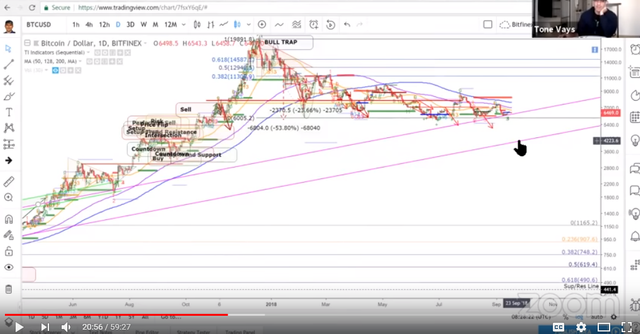
The daily chart is breaking down towards the top of a channel that has started to form in August of 2015, as the 2014 bear market ended, and has held the price of bitcoin up until May of 2017, where we’ve been trading above ever since. “It’s okay to go back in to this channel, this channel was beautiful, we should have never left this channel, it would have been orderly, it would have been calm, everyone would have been collected, we could have been above $4K by now, at an all-time high and everyone would have been happy. Except, right now, everyone is pissed off because they think bitcoin is supposed to be higher for no reason whatsoever.”
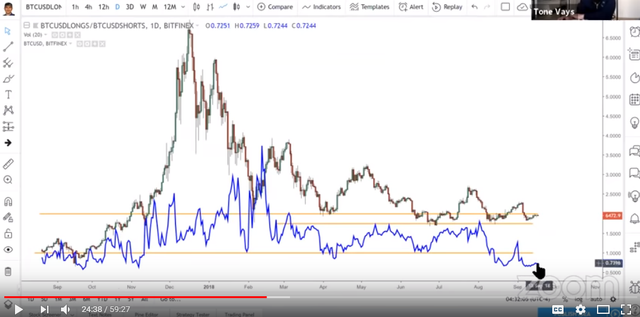
Shorts are still over leveraged, currently at the highest ratio to the longs this year, and might need to get wrecked before the price actually goes lower.
@resteemator is a new bot casting votes for its followers. Follow @resteemator and vote this comment to increase your chance to be voted in the future!
Congratulations @louwtjie! You have completed the following achievement on the Steem blockchain and have been rewarded with new badge(s) :
Click here to view your Board of Honor
If you no longer want to receive notifications, reply to this comment with the word
STOPDo not miss the last post from @steemitboard:
Congratulations @louwtjie! You received a personal award!
You can view your badges on your Steem Board and compare to others on the Steem Ranking
Do not miss the last post from @steemitboard:
Vote for @Steemitboard as a witness to get one more award and increased upvotes!