BTCUSD Update June 9, 2018 --- Price is Rising -- but is this the UPTREND? Too early to say yet!
HI Everyone,
I am pleased to share with you my Elliot wave perspective on Bitcoin BTCUSD price.
My previous charts are given below and here is updated chart and commentary for today.
June 9 , 2018
.png)
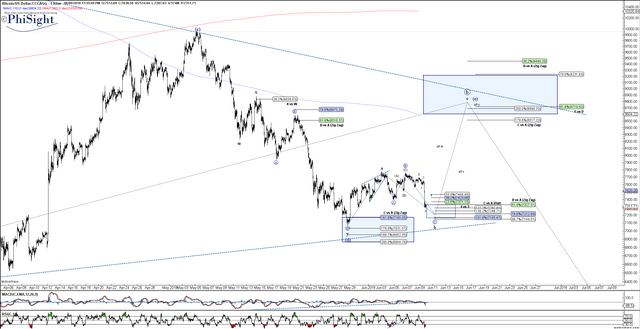
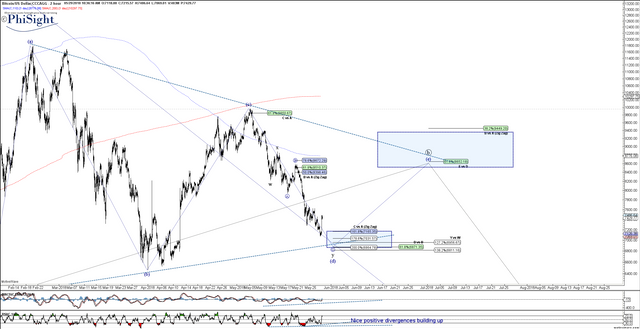
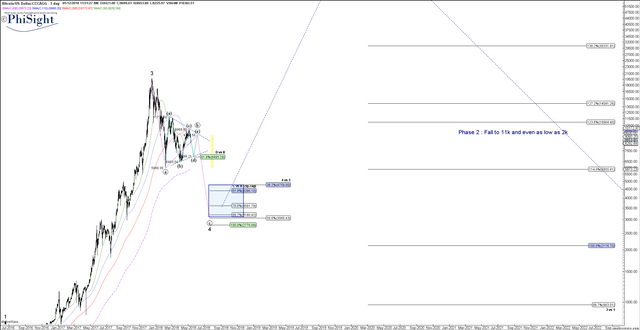
So it seems that a corrective wave (labeled as a b-wave in the chart above) has materialized as expected. It should bottom between 7144-7212 range and then price should move up. I am still considering this rise as a corrective overall rise above in the last leg of a triangle. There are other interpretations that can be applied but to keep it simple, I am posting the main one I see as highest probability and will follow it till it invalidates. So far, price seems to be following expectations.
June 5, 2018: https://steemit.com/bitcoin/@phisight/btcusd-update-price-is-rising-but-is-this-the-uptrend-too-early-to-say-yet
June 5, 2018 1 hour chart:
.png)
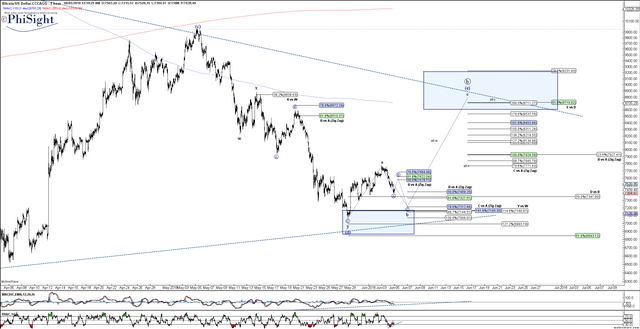
June 5, 2018 3 hour chart:
.png)
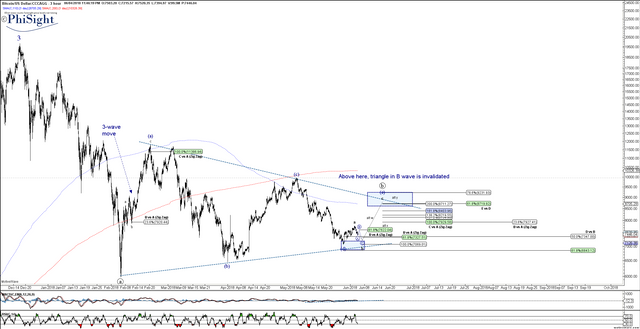
June 5, 2018 6 hour chart:
.png)
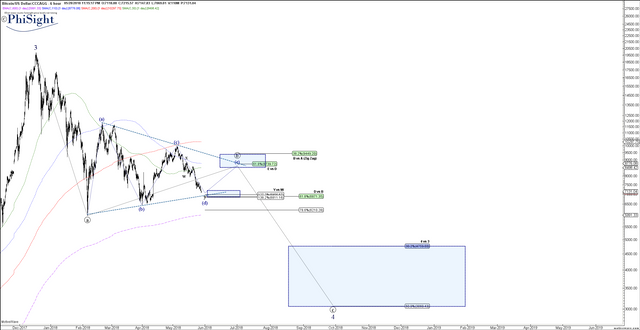
June 5th, 2018 comments: Price is rising but my primary feeling is that this rise is part of a three wave move into an e-wave of a B-wave triangle. The path that this could take is given in the charts above and seems to be tracing it out quite nicely. I would be carefully looking for topping signs in the blu box given in the charts! If it blows through them, great! IF not, it is a possibility to see a sharp move down to new lows. I still think long term that the price is going to stratospheric new heights, so I am overall very bullish on this complex. A corrective move down into the 3000-4700 region would be a very nice buying opportunity!
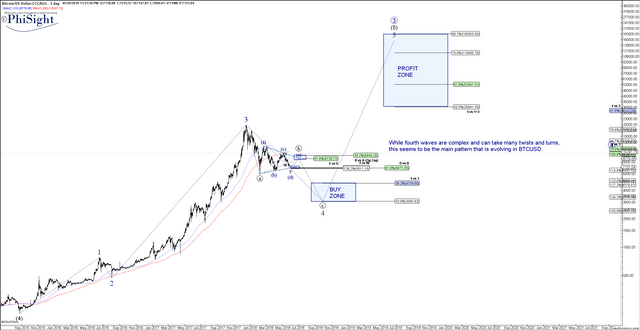
Here are my previous posts and charts and seems the analysis has been spot on SO FAR! Corrective fourth waves can take many twists and turns and while I am showing the primary path of the many that can be imagined at this time, if the primary expectation changes, I will surely update the steemit board.
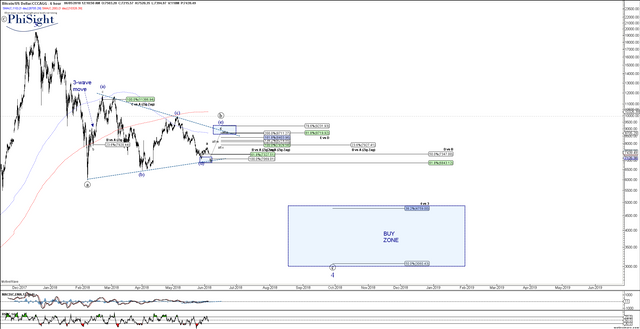
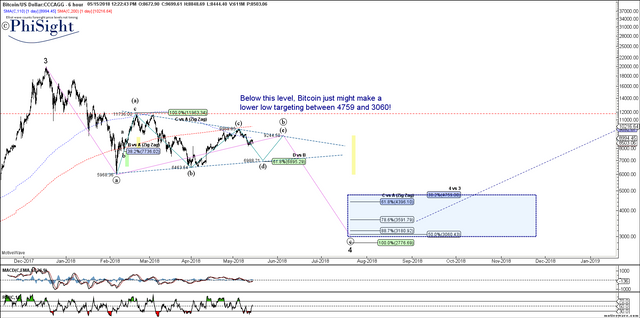
May 29, 2018, I posted this 6 hour chart on BTCUSD:
https://steemit.com/bitcoin/@phisight/bitcoin-btcusd-update-price-is-bouncing-as-expected
.png)
May 28, 2018, I published this chart that indicated a bounce is coming and a bounce we seem to have got.
https://steemit.com/bitcoin/@phisight/bitcoin-update-from-elliot-wave-perspective
.png)
and here is May 28, 2018 Daily chart on BTCUSD:
.png)
May 15, 2018: https://steemit.com/bitcoin/@phisight/bitcoin-update-using-elliot-wave-counts-btcusd-btc-usd
_Posted.png)
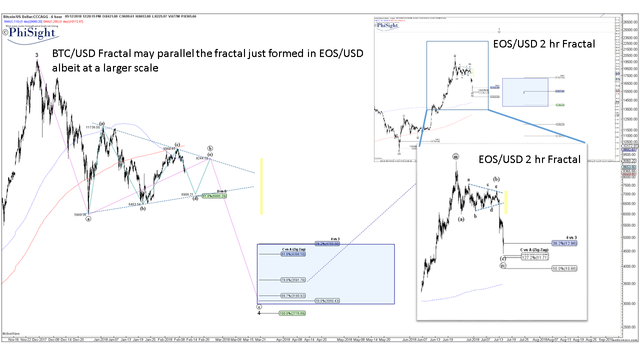
May 12, 2018 https://steemit.com/photography/@phisight/bitcoin-chart-pattern-rhymes-with-ongoing-fractal-in-eos
%20_Posted.png)
I also provided an example of the ongoing fractal in EOSUSD that has a similar pattern:
I am hoping to provide Elliot wave analyis on STEEM for all cryptocurrencies if I get your support. I hope you liked this post, and if you did, please upvote me, and resteem my post to your followers.
Hope this analysis was/is/will be helpful! Note: you can right-click and open charts in new tab to see them at full size -- they are quite large and clearer when expanded.