BTC breaks daily kajun (whatever that means!)
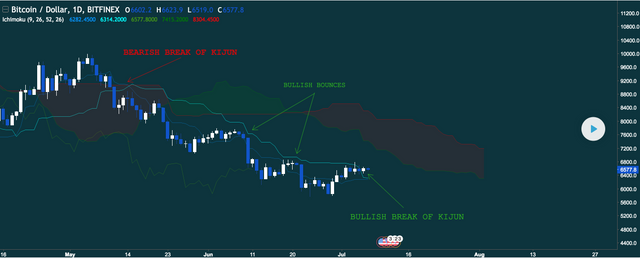
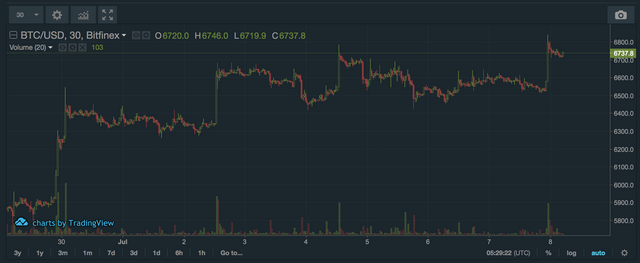
Or is it a KIJUN? One of the many writers on Trading View posted this chart 14 hours ago and since then BTC has enjoyed a solid pump up above $6700 for the second time in a week.
The price is currently sitting at $6,737 and based on the upward movement of the last week we are potentially moving out of what has been a difficult year for crypto so far.
At the beginning of this year I created my own chart to remind myself that even when everything seems to be going down there is a bigger picture to see in stepping back and examining where we were one year ago.
I hope you enjoy this chart as much as I do :)
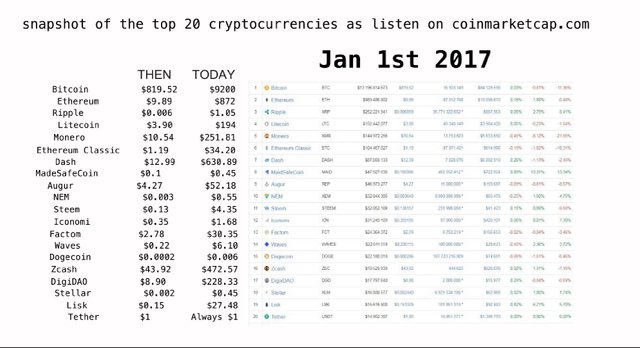
ONWARD & UPWARD!
Now a days Bitcoin price managed by Bitcoin futures contracts groups such as CME & Cboe.
they constructed people mindsets. that means , whenever contracts get expired, bitcon will falll. , its happend from last six month, according to their date of expire. due to this mindset, people sell our bitcoin even small , medium pump. but my prediction is , its a game of wheals.
surely they entered next week or next 1 or 2 months in the market, give reverse game to the market after feature contracts expiry and BITCON reaches once again all time high.
Dear samstonehill , I gave you an upvote on your post. Please give me a follow or your upvote on my feture posts and
I will also give you a follow in return and possible future votes...
Team work always works. Thanking you.
frankly I think trying to predict prices based on charts is utter bullshit. Your time would be better spent visualizing the movements you would like to see.
I have to admit I am inclined to agree! But they do at least sometimes serve as a good starting point for that visualisation :)