BITCOIN: Symmetrical Triangle = High Indecision
BITCOIN has been moving around the 6530 USD price, one day more. The only remarkable thing we can see in its chart is the almost finalisation of a symmetrical triangle there...
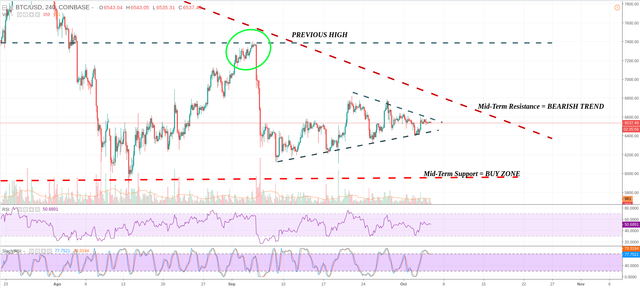
...and what does "symmetrical triangle" mean? It means more INDECISION
Triangular patterns are very frequent in crypto, they used to indicate a continuation of the trend depending if the shape is an "ascending" or "descending" triangle...
But this is not the case with a "Symmetrical Triangle" which is now on going.
A "Symmetrical Triangle" may indicate a sudden change but the problem is that we cannot forecast in which direction, up or down... Let's say that we have a 50% of probabilities to guess it, while in the other two types we have a higher likelihood of hit the proper direction of the next move...
But at least we can trace some "boundaries" that used to work in this case, either upwards or downwards.
Break out upwards:
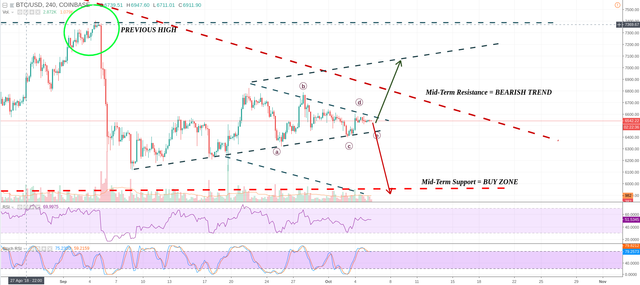
If so, BTC will also break the MID-TERM Resistance and then we will have to see if it can also overpass the previous high, which for me is an important condition to declare a reversal.Break out downwards:
BITCOIN would test by 4th time the lowest price of the year and will enter again in the BUY ZONE where many orders are awaiting for, ranging between 5800 to 6000 USD.
Having a look at the Stochastic RSI, BITCOIN seems overbought while RSI gives a little bit of margin upwards... perhaps we may see one last rebound inside this narrow triangle before the next important movement...
Enjoy!
*Disclaimer: This is just my personal point of view, please, do your own assessment and act consequently.
Neither this post nor myself is responsible of any of your profit/losses obtained as a result of this information.
Published on

by toofasteddie

Looks like we are just about broke upwards of the very long term triangle. You should have seen the 1 minute pump, from $6563 to $6621.
Now we need it to hold above the top of the triangle for longer time frames and everyone will feel a little bit more confident, meaning we are likely to head to $6800 as the next stop.
I'm not so happy about another fake pump up, because that means that going down is postponed for more months.
I saw that candle, just when I posted yes...we need more volume to go upwards