Bitcoin - Thoughts on some Woobull Charts - 10.10.2018

Woobull lists some interesting Bitcoin charts.
Given the lack of clear direction of the BTC/USD market, I looked closer at some of these charts to see whether they can reveal what we can expect from the market, compared to the past.
1. NVT Signal
The so-called NVT Signal is the most interesting chart.
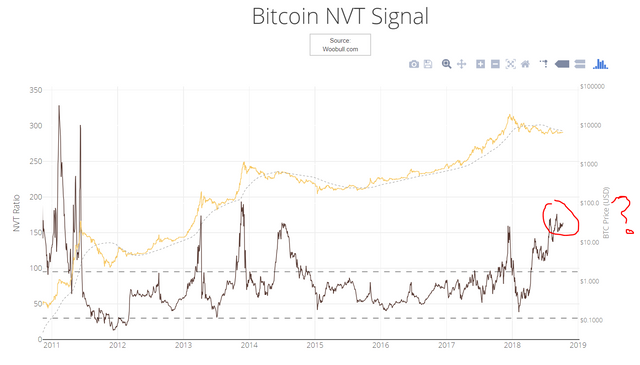
source: Woobull charts
It is my understanding that this indicator is a reworked calculation of network activity/value (i.e., the use of Bitcoin as a payment medium) versus the BTC/USD price.
As you can see, it neatly fits the prior bubbles and busts giving - on a larger time scale - pretty good signals on when the bull is ageing and when to start loading up again during market bottoms.
But for the current situation something is off. Very off.
- either Bitcoin is extremely overvalued right now, even more than the recent USD19k top
- or something fundamentally changed rendering the NVT Signal worthless
A plausible explanation may be transaction batching: putting more transactions in an input and/or output part (see link for a better explanation). I have no information (or knowledge) to verify whether this could clarify the apparent anomaly. I understand Willy Woo confirms that batch transactions do not have an impact on the NVT ratio.
Assuming linear relationships, price may have to go to $2,2xx (with everything else staying equal) for this indicator hitting about 50 for a clear 'buy' signal.
I am curious (but undecided).
2. Bitcoin Mayer Multiple
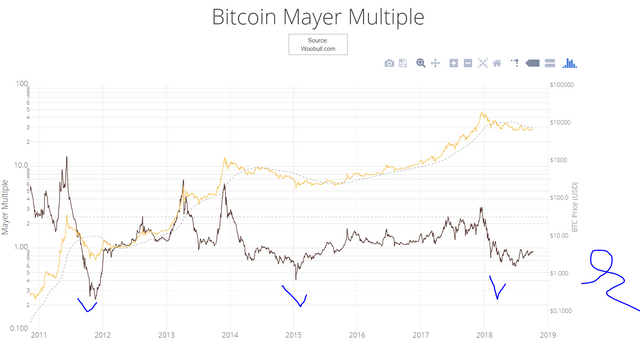
source: Woobull charts
The Bitcoin Mayer Multiple is closer to our gut feeling that a bottom has been set or is close to being finalised in the $6,xxx zone. There is some room to hit the lows seen in the 2015 period but the 2018 period at least shows a nice bottom in the indicator followed by upward action.
A point for the bullish case I would say.
3. Bitcoin ROI vs Other Asset Classes
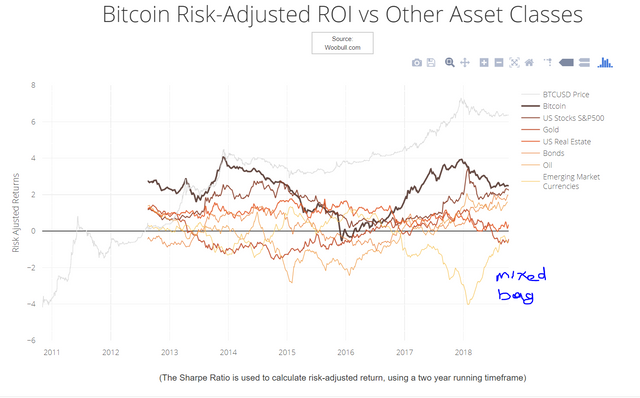
source: Woobull charts
This chart does not give conclusive signals. We could see confirmation of a bottom forming/having formed, but the bottom is not very deep compared to the 2014/2015 bear market. The chart lacks some history with data for the 2011/2012 bear market missing.
Inconclusive.
4. Bitcoin Velocity vs USD Money Stock
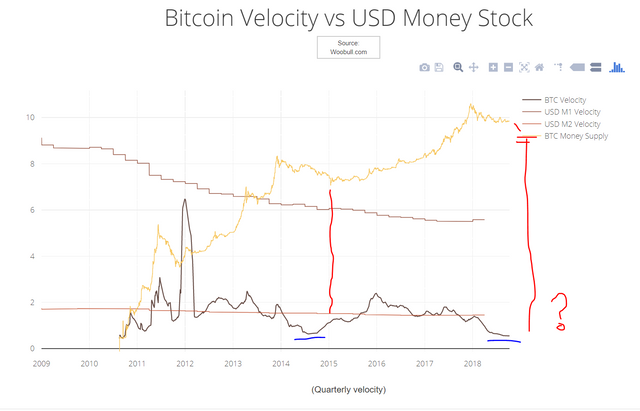
source: Woobull charts
The problem with this chart is that it is - from my perspective - highly subject to interpretation. My best guess in finding a repeating pattern is that we reached a moment of low volatility after which one final volatility surge can be expected - the move to capitulation. But there is no clear indication that this happened more in the past other than in the long 2014/2015 bear market. Peaks of highs and lows aren't that clear/pronounced either.
I take it as a sign of bottoming, while having no clue whether this means that $6,xxx is it for the lows or that we could still expect to see much lower prices.
5. Conclusion
I hope you enjoyed looking at these charts and look forward hearing your thoughts.
Congratulations @wekkel! You received a personal award!
You can view your badges on your Steem Board and compare to others on the Steem Ranking
Vote for @Steemitboard as a witness to get one more award and increased upvotes!
Congratulations @wekkel! You received a personal award!
You can view your badges on your Steem Board and compare to others on the Steem Ranking
Do not miss the last post from @steemitboard:
Vote for @Steemitboard as a witness to get one more award and increased upvotes!