A reversed head & shoulder pattern is forming
Bitcoin Daily Chart Bitfinex
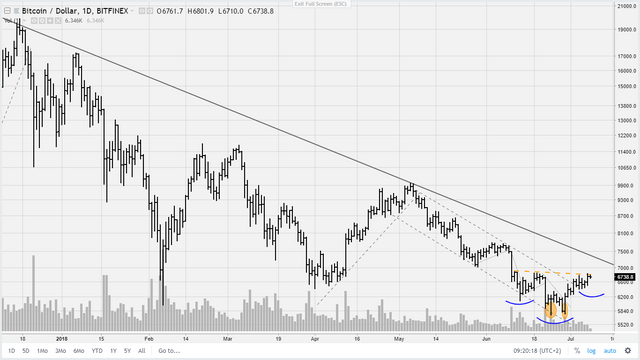
After the double bottom last week prices stayed above the lows nicely. Bitcoin is now pushing against a resistance level at 6800$ (orange dotted line). If prices break through that resistance, good. But a more likely continuation seems to be to first have a small pullback to the previous shoulder at approximately 6250$. Then, a H&S reversed pattern will form which can be confirmed when the 6800 level is taken out; thus creating a target of circa 7700 which would imply that also the weekly resistance line gets broken for an overall more bullish picture.
Let's have a look at the indicators.
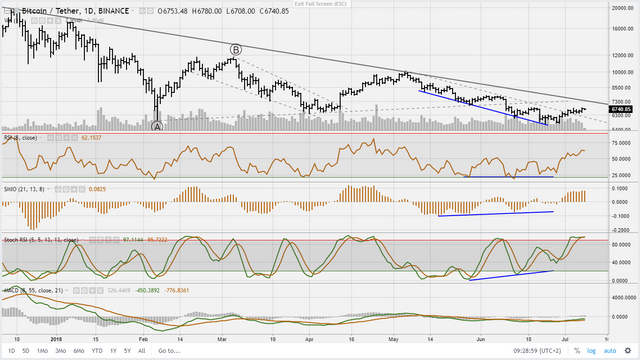
On the daily chart we can see divergences on the RSI, Ergodic Oscillator and Stochastic RSI and the MACD signal line (green) has crossed above the MACD (light camel brown) which is bullish. The only issue is that the Stochastic RSI is high. It would have been better when the Stochastic RSI would have been low.
Weekly Chart
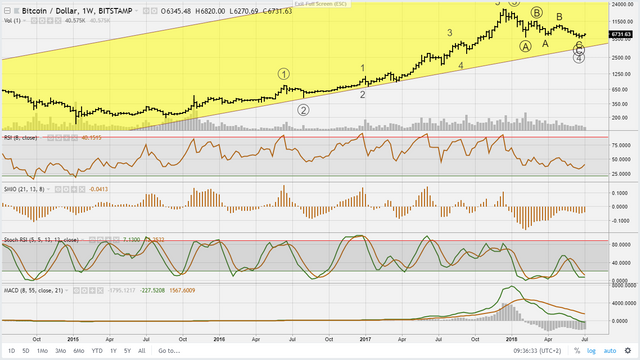
On the weekly chart the Stochastic RSI is low, with, in addtion, the Ergodic Oscillator and the MACD histogram diverging. This is bullish.
8 hour chart
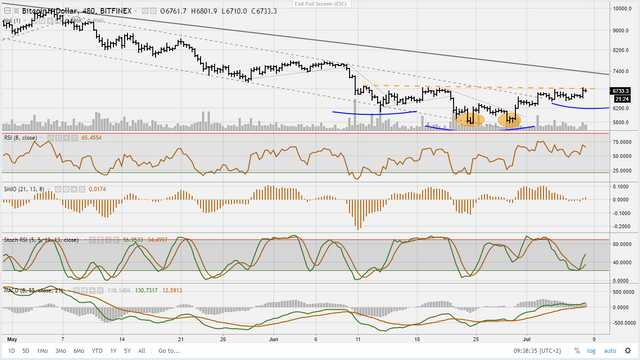
Zooming in to the 8 hour chart, we can see the Stochastic RSI is climbing up a bit.
Moving Forward
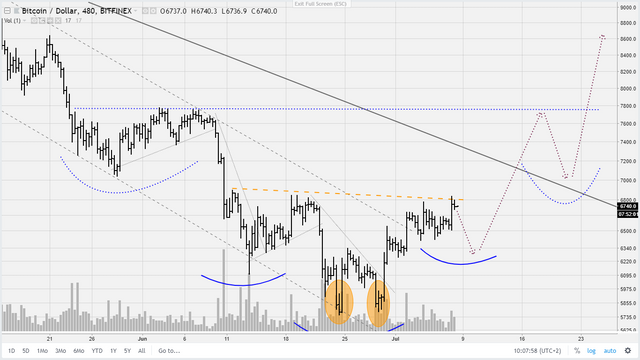
In conclusion I'd say a slow drop to around 6250$ is very likely, could take a week or so, then it becomes time to move up again, ideally to 7700$ where some resistance can be found (blue dotted line). Should we then drop to 7000$, a second, and larger, head & shoulder reversed pattern can there be formed (blue dotted half circles) with a target of 9700$. If and when we get there, we'll have to re-analyse.
But ofcourse there is always the possibility of dropping to new lows as there is no certainty in technical analysis. Nonetheless, I'm still moderately bullish (and getting more bullish) and have added a straddle to my original position.