BTCUSD 12 July 2019 Daily Update Symmetrical Triangle Formed
.png)
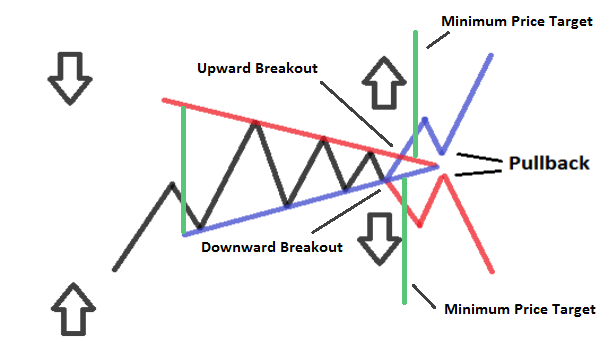
Seeing this chart on 4 hour timeframe, appears to be a Symmetrical Triangle Beginning to Form as it already made a lower high but still in higher low. IF the price action still maintain above 1st trendline.
It's possible in this short term bearish movement each trendline will be test in the short future. Breaking each trendline is tightening the price action movement in between these trendline on the chart and the more it's break it the more bearish it would be for btcusd. See the chart for the potential resistance and support for short term.
.png)
Indicators 4 hours from top to bottom :
USDT Supply still rising expontial as it's still made a high low and higher high.
DMI : -DI (seller power) is rising and challenge +DI (buyer power) as this time i expect a slow price volatility and ADX (momentum strength) is currently reduce.
MACD : histogram is slightly reduce it's seller momentum althougth it's to early to tell for the trend switching yet. MACD line is hovering toward bearish zone.
RSI : On Neutral zone and still made a lower low compare to previous drop in RSI.