ETH/BTC Update
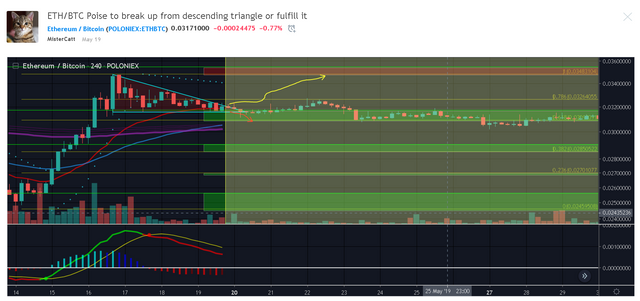
Seems it's very dull movement happening for ETH/BTC since may 19 2019. less volatile ever since..
Sideways for quite some times above 200 EMA is good as accumulation is in progress in my opinion. as long price action above 200 EMA i'm quite positive for this asset.
Indicators :
MFI still create a higher low following the recent price action movement which also creating higher low.
MACD slight divergence between histogram and price action as the buyer histogram is lower than previous high.
Volume MA still flat lining.
please take this idea as a grain of salt as reality always differ from what i expect as this post merely just an opinion.
and please feel free to share what your thought on comment section.
peace.


.png)
