Update Gold/USD (XAUUSD)
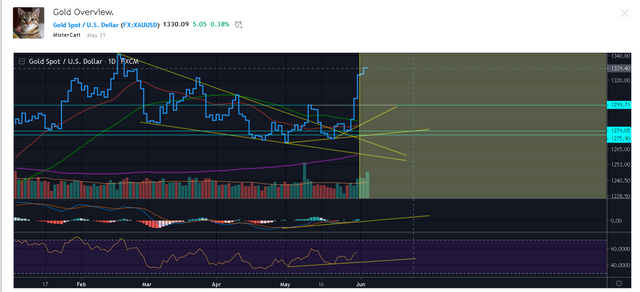
Update for Gold/USD from falling wedge pattern is achieve for short term time.
On the weekly chart.. Price action is all above the Moving averages.
From DMI also look bullish, DMI+ spikes up above DMI- indicate a bullish trend. Keep in mind that DMX is still below 25 which is very low momentum strength for now.
it also possible it would broke the short term trendline within the symmetrical triangle and retest the yellow trendline below.
see the price value for the expected support also resistance.
.png)
DMI
.png)
As long the price action above the trend line extending yellow line. i think it will doing just fine.
please take this idea as a grain of salt as reality always differ from what i expect as this post merely just an opinion.
and please feel free to share what your thought on comment section.
peace.