XRP/BTC Update
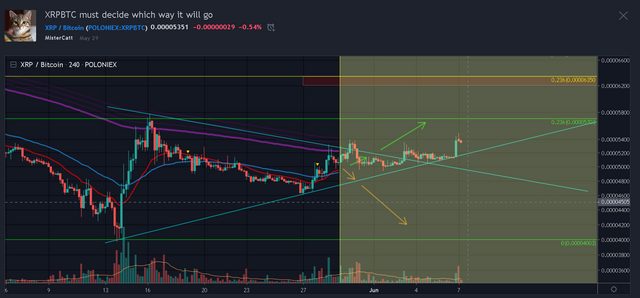
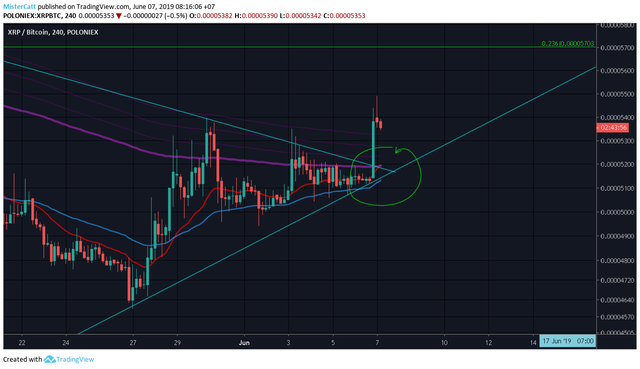
Update from my xrp/btc chart.. it seems still holding it's trendline pretty well.
.png)
Indicators:
DMI : DMI+ rise above DMI- indicate a pressure to the upside. DMX still below 25 level which is still very weak momentum strength for now.
MACD: Macd line give a bullish signal also a buyer histogram higher than previous high and it is still developing.
Volume MA is rising a bit and getting dominated by a seller volume for now.
as long the price action above EMAs line (5200satoshi) and following a trendline, bullish trend might becoming clear for this asset.
200 EMA and 21 also 50 will converge in the near future creating golden cross. doesnt necessary mean a significant gain will happen immediately but it indicate a trend is beginning to switch to bullish side.
please take this idea as a grain of salt as reality always differ from what i expect as this post merely just an opinion.
and please feel free to share what your thought on comment section.
peace.