BTC with Accumulation Schematic #1 : Wyckoff Events
안녕하세요 AntLover 입니다.
Wyckoff의 분석 방법 중 하나인 Accumulation Schematic를 비트코인 차트에 대입해봤을 때 유사한 그림으로 진행된 모습을 확인하여서 앞으로의 진행도 비슷하게 흘러간다고 가정했을 때 그려 본 차트 입니다.
[Accumulation Schematic #2 : Wyckoff Phases 분석 링크]
아래쪽에 Wyckoff의 차트에 대한 설명을 기재해 놨습니다. 설명 글이 전부 영어라 원문 내용과 구글 번역 내용을 같이 올리도록 하겠습니다. (기계 번역이라 매끄럽지 못한 점 양해 부탁드립니다.)
BTC with Accumulation Schematic #1 : Wyckoff Events
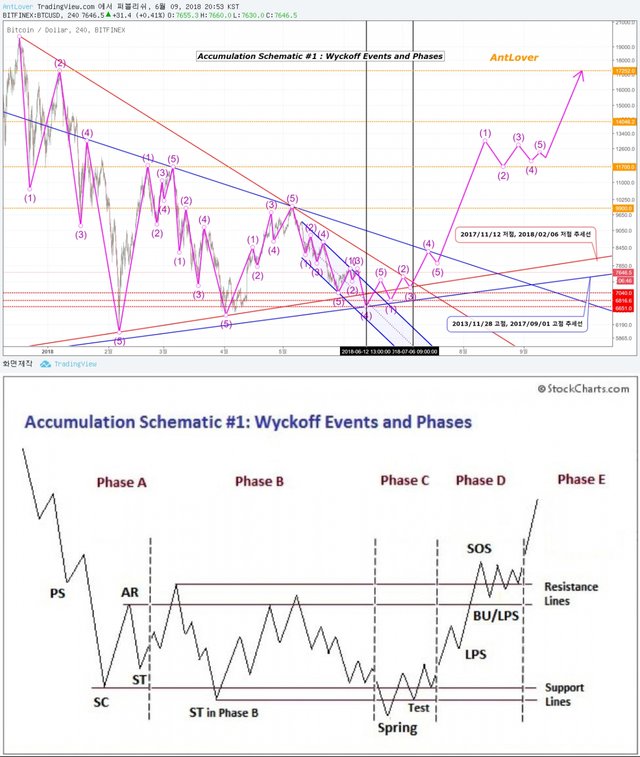
가격 예측은 제 임의로 정한 것이기에 위 사진과 같은 모습으로 흘러갈 수도 있다는 것만 봐주시면 감사합니다 :)
현재 (3)에서 (4)로 진행중인 것으로 본다면,
- (4) 진행 시 하단 파란색 추세선 부근인 6650$ 까지 하락
- (5) 진행 시 7400$ 까지 상승
- 다시 (1) 진행 시 6800$ 까지 하락
- (2) 진행 시 상단 빨간색 추세선 부근인 7500$ 까지 상승
- (3) 진행 시 하단 빨간색 추세선 부근인 7200$ 까지 하락
- (4) 진행 시 상단 파란색 추세선 부근인 8300$ 까지 상승
- (5) 진행 시 7900$ 까지 하락
- 다시(1) 진행 시 13000$ 까지 상승
- (2) 진행 시 11700$ 까지 하락
- (3) 진행 시 12800$ 까지 상승
- (4) 진행 시 12000$ 까지 하락
- (5) 진행 시 12400$ 까지 상승
- 이후 17250$ 까지 상승
Three Wyckoff Laws
Wyckoff's chart-based methodology rests on three fundamental “laws,” which affect many aspects of analysis, including: determining the market's and individual stocks' current and potential future directional bias, selecting the best stocks to trade long or short, identifying the readiness of a stock to leave a trading range, and projecting price targets in a trend from a stock’s behavior in a trading range. These laws inform the analysis of every chart and the selection of every stock to trade.
The law of supply and demand determines the price direction. This principle is central to Wyckoff's method of trading and investing. When demand is greater than supply, prices rise, and when supply is greater than demand, prices fall. The trader/analyst can study the balance between supply and demand by comparing price and volume bars over time. This law is deceptively simple, but learning to accurately evaluate supply and demand on bar charts and to understand the implications of supply and demand patterns takes considerable practice.
The law of cause and effect helps the trader and investor set price objectives by gauging the potential extent of a trend emerging from a trading range. Wyckoff's “cause” can be measured by the horizontal point count in a point-and-figure chart, while the “effect” is the distance price moves corresponding to the point count. This law's operation can be seen as the force of accumulation or distribution within a trading range—and how this force works itself out in a subsequent trend or movement up or down. Point-and-figure chart counts are used to measure a cause and to project the extent of its effect. (See “Point and Figure Count Guide” below for an illustration of this law.)
The law of effort versus result provides an early warning of a possible change in trend in the near future. Divergences between volume and price often signal a change in the direction of a price trend. For example, when there are several high-volume (large effort) but narrow-range price bars after a substantial rally, with the price failing to make a new high (little or no result), this suggests that big interests are unloading shares in anticipation of a change in trend.
Analyses of Trading Ranges
One objective of the Wyckoff method is to improve market timing when establishing a position in anticipation of a coming move where a favorable reward/risk ratio exists. Trading ranges (TRs) are places where the previous trend (up or down) has been halted and there is relative equilibrium between supply and demand. Institutions and other large professional interests prepare for their next bull (or bear) campaign as they accumulate (or distribute) shares within the TR. In both accumulation and distribution TRs, the Composite Man is actively buying and selling, the distinction being that in accumulation, the shares purchased outnumber those sold, while in distribution the opposite is true. The extent of accumulation or distribution determines the cause that unfolds in the subsequent move out of the TR.
Wyckoff Schematics
A successful Wyckoff analyst must be able to anticipate and correctly judge the direction and magnitude of the move out of a TR. Fortunately, Wyckoff offers time-tested guidelines for identifying and delineating the phases and events within a TR, which in turn provide the basis for estimating price targets in the subsequent trend. These concepts are illustrated in the following four schematics; two depicting common variants of accumulation TRs, followed by two examples of distribution TRs.
Accumulation: Wyckoff Events
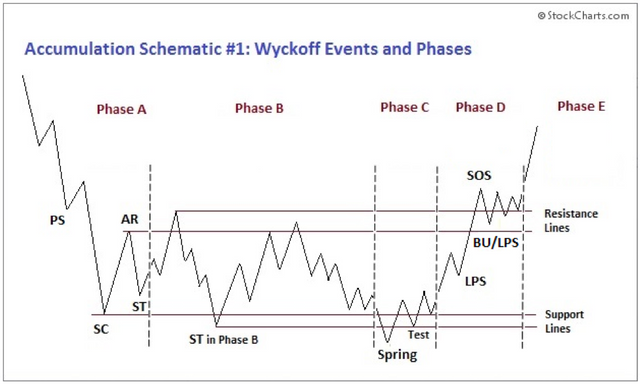
- PS—preliminary support, where substantial buying begins to provide pronounced support after a prolonged down-move. Volume increases and price spread widens, signaling that the down-move may be approaching its end.
- SC—selling climax, the point at which widening spread and selling pressure usually climaxes and heavy or panicky selling by the public is being absorbed by larger professional interests at or near a bottom. Often price will close well off the low in a SC, reflecting the buying by these large interests.
- AR—automatic rally, which occurs because intense selling pressure has greatly diminished. A wave of buying easily pushes prices up; this is further fueled by short covering. The high of this rally will help define the upper boundary of an accumulation TR.
- ST—secondary test, in which price revisits the area of the SC to test the supply/demand balance at these levels. If a bottom is to be confirmed, volume and price spread should be significantly diminished as the market approaches support in the area of the SC. It is common to have multiple STs after a SC.
- Test—Large operators always test the market for supply throughout a TR (e.g., STs and springs) and at key points during a price advance. If considerable supply emerges on a test, the market is often not ready to be marked up. A spring is often followed by one or more tests; a successful test (indicating that further price increases will follow) typically makes a higher low on lesser volume.
- SOS—sign of strength, a price advance on increasing spread and relatively higher volume. Often a SOS takes place after a spring, validating the analyst’s interpretation of that prior action.
- LPS—last point of support, the low point of a reaction or pullback after a SOS. Backing up to an LPS means a pullback to support that was formerly resistance, on diminished spread and volume. On some charts, there may be more than one LPS, despite the ostensibly singular precision of this term.
BU—”back-up”. This term is short-hand for a colorful metaphor coined by Robert Evans, one of the leading teachers of the Wyckoff method from the 1930s to the 1960s. Evans analogized the SOS to a “jump across the creek” of price resistance, and the “back up to the creek” represented both short-term profit-taking and a test for additional supply around the area of resistance. A back-up is a common structural element preceding a more substantial price mark-up, and can take on a variety of forms, including a simple pullback or a new TR at a higher level.
세가지 Wyckoff 법칙
Wyckoff의 차트 기반 방법론은 분석의 여러 측면에 영향을 미치는 세 가지 기본 "법칙"에 의존합니다. 즉, 시장 및 개별 주식의 현재 및 잠재적 방향성 편향성 결정, 장기 또는 단기 교역을위한 최고의 주식 선택, 거래 범위를 벗어나는 주식, 그리고 거래 범위의 주식 행동의 추세에 따라 목표 가격을 투사합니다. 이 법은 모든 차트의 분석과 거래 할 모든 주식의 선택을 알려줍니다.
수요와 공급의 법칙은 가격 방향을 결정한다. 이 원칙은 Wyckoff의 거래 및 투자 방법의 핵심입니다. 수요가 공급보다 크면 가격이 상승하고 공급이 수요보다 클 때 가격이 하락합니다. 상인 / 애널리스트는 시간과 가격을 비교하여 수요와 공급 간의 균형을 연구 할 수 있습니다. 이 법은 믿을 수 없을만큼 간단하지만, 가로 막 대형 차트에 대한 수요와 공급을 정확하게 평가하고 공급 및 수요 패턴의 함의를 이해하는 것을 배우는 것은 상당히 실용적입니다.
원인과 결과의 법칙은 거래 범위에서 나오는 추세의 잠재적 범위를 측정함으로써 상인과 투자자가 가격 목표를 설정하는 데 도움이됩니다. Wyckoff의 "원인"은 포인트 앤 피규어 차트의 수평 포인트 수로 측정 할 수 있지만 "효과"는 포인트 수에 해당하는 거리 가격 이동입니다. 이 법의 운영은 거래 범위 내에서의 축적 또는 분배의 힘으로 볼 수 있으며,이 추세가 후속 추세 나 위 또는 아래로의 이동에서 어떻게 작동 하는지를 볼 수 있습니다. 포인트 - 앤 - 피규어 차트 수는 원인을 측정하고 그 영향 범위를 투사하는 데 사용됩니다. (이 법에 대한 설명은 아래의 "포인트 앤 카운트 카운트 가이드"를 참조하십시오.)
노력 대 결과 의 법칙은 조만간 추세의 가능한 변화에 대한 조기 경보를 제공합니다. 물량과 물가의 차이는 종종 가격 추세의 변화를 의미합니다. 예를 들어, 가격이 새롭지 않고 (결과가 거의 없거나 전혀 없음) 상당한 액트가 발생한 후에 대용량 (큰 노력)이지만 좁은 범위의 가격 막대가있는 경우 큰 이익이 주식을 경향 변화 예상.
거래 범위 분석
Wyckoff 방법의 한 가지 목적은 호의적 인 보상 / 위험 비율이 존재하는 다가올 움직임을 예상하여 포지션을 수립 할 때 시장 타이밍을 개선하는 것입니다. 거래 범위 (TR)는 이전 추세 (위 또는 아래)가 중단되었고 수급간에 상대적 균형이있는 곳입니다. 기관 및 기타 대규모 전문 분야의 이해 관계자는 TR 내에서 주식을 축적 (또는 배포) 할 때 다음 번 황소 (또는 곰) 캠페인을 준비합니다. 누적 및 유통 TR 모두에서 Composite Man은 적극적으로 매매하고 있으며, 누적 된 주식은 판매 된 주식의 수보다 많으며 분배의 경우에는 그 반대가 사실입니다. 축적 또는 분배의 정도는 TR의 후속 이동에서 펼쳐지는 원인을 결정합니다.
Wyckoff 회로도
Wyckoff의 성공적인 분석가는 TR 밖의 이동의 방향과 규모를 예견하고 정확하게 판단 할 수 있어야합니다. 다행스럽게도 Wyckoff는 TR 내에서 위상 및 이벤트를 식별하고 묘사하는 데 시간이 많이 걸리는 지침을 제공합니다. 그러면 다음 추세에서 가격 목표를 추정 할 수있는 기반을 제공합니다. 이러한 개념은 다음의 네 가지 도식으로 설명됩니다. 두 가지는 축적 TR의 공통 변형을 묘사하고, 두 가지 배포 TR의 예가 뒤 따른다.
누적 : Wyckoff 이벤트
- PS- 예비 지원. 장기 구매 계약을 통해 실질적인 구매가 뚜렷한 지원을 제공합니다. 볼륨 증가 및 가격 스프레드가 확대되어 다운 그 이동이 끝나고 있음을 알립니다.
- SC 판매 절정 , 확대 확산 및 판매 압력은 일반적으로 클라이 막스 및 대중에 의해 무거운 또는 공황 판매가 큰 또는 가까운 밑바닥 근처에 큰 전문적인 이익에 의해 흡수되고있다 요점. 가격은 종종 SC의 낮은 가격에서 잘 닫히고 이러한 큰 이익으로 인한 구매를 반영합니다.
- AR- 자동 랠리 는 강렬한 판매 압력이 크게 감소했기 때문에 발생합니다. 구매의 물결로 인해 가격이 쉽게 상승합니다. 이것은 짧은 커버링에 의해 더욱 촉진된다. 이 집회 중 최고는 축적 TR의 상위 경계를 정의하는 데 도움이됩니다.
- ST-두번째 테스트. 이 단계 에서 가격은 SC의 영역을 재검토하여이 수준에서 수요 / 공급 균형을 테스트합니다. 바닥을 확인하는 경우 시장이 SC 영역에서 지원을 받으면 볼륨 및 가격 스프레드가 현저하게 감소해야합니다. SC 후에는 여러 개의 ST를 갖는 것이 일반적입니다.
- 테스트 - 대규모 운영자는 항상 TR (예 : ST 및 스프링)을 통한 공급 및 가격 상승 중 주요 지점에서 시장을 테스트합니다. 상당한 공급이 테스트에서 나오면, 시장은 종종 마크 업 할 준비가되어 있지 않습니다. 봄에는 종종 하나 이상의 테스트가 이어집니다. 성공적인 테스트 (추가 가격 인상이 뒤따를 것임을 나타냄)는 일반적으로 적은 양으로 더 높게 책정됩니다.
- SOS- 힘의 표시 , 스프레드가 증가하고 가격이 상대적으로 높습니다. SOS는 봄이 지나면 종종 발생하며 분석가의 이전 조치에 대한 해석을 확인합니다.
- LPS- 지원의 마지막 지점 , SOS 후의 반응 또는 풀백의 낮은 지점. 뇌 보호 시스템 (LPS)에 백업한다는 것은 이전에는 저항이었던 확산을 줄이고 볼륨을 줄이는 데 도움이되었다는 것을 의미합니다. 일부 차트에서는이 용어의 표면 상으로는 단수의 정밀도에도 불구하고 둘 이상의 LPS가있을 수 있습니다.
- BU- "백업" . 이 용어는 1930 년대부터 1960 년대까지의 Wyckoff 방법의 선구자 중 한 명인 Robert Evans가 만든 화려한 은유를 간략하게 표현한 것입니다. 에반스는 SOS가 가격 저항에 대한 "점프 건너 뛰기"에 대해 유추했으며, "크릭까지의 백업"은 단기 이익 획득과 저항 영역 주변의 추가 공급에 대한 테스트를 모두 나타 냈습니다. 백업은보다 실질적인 가격 인상을 앞두고 공통적 인 구조적 요소이며 단순한 철회 또는 상위 수준의 새로운 TR을 포함하여 다양한 형태를 취할 수 있습니다.