BTC with Accumulation Schematic #2 : Wyckoff Phases
안녕하세요 AntLover 입니다.
Wyckoff의 분석 방법 중 하나인 Accumulation Schematic를 비트코인 차트에 대입해봤을 때 유사한 그림으로 진행된 모습을 확인하여서 앞으로의 진행도 비슷하게 흘러간다고 가정했을 때 그려 본 차트 입니다.
[Accumulation Schematic #1 : Wyckoff Events 분석 링크]
아래쪽에 Wyckoff의 차트에 대한 설명을 기재해 놨습니다. 설명 글이 전부 영어라 원문 내용과 구글 번역 내용을 같이 올리도록 하겠습니다. (기계 번역이라 매끄럽지 못한 점 양해 부탁드립니다.)
BTC with Accumulation Schematic #2 : Wyckoff Phases
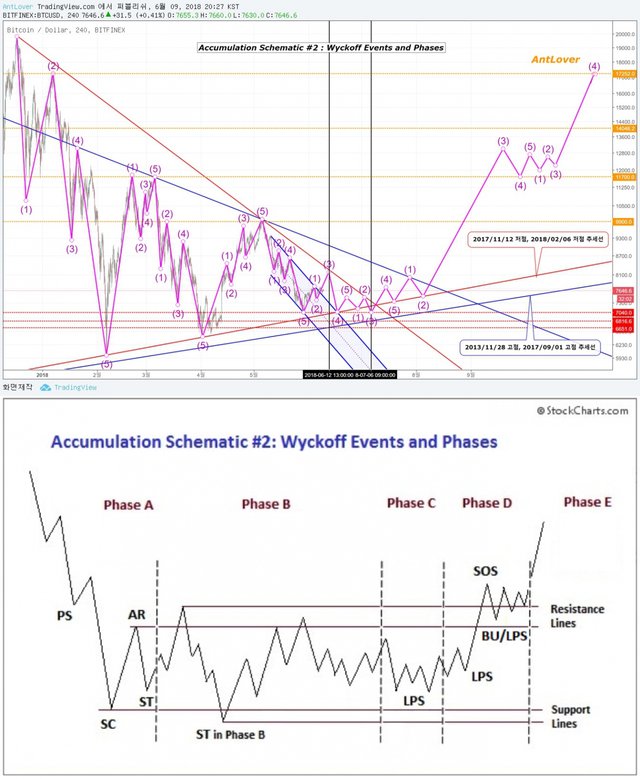
가격 예측은 제 임의로 정한 것이기에 위 사진과 같은 모습으로 흘러갈 수도 있다는 것만 봐주시면 감사합니다 :)
현재 (2)에서 (3)으로 진행중인 것으로 본다면,
- 상단 빨간색 추세선 부근인 8200$ 까지 상승
- (4) 진행 시 하단 빨간색 추세선 부근인 7000$ 까지 하락
- (5) 진행 시 7400$ 까지 상승
- 다시 (1) 진행 시 하단 빨간색 추세선 부근인 7100$ 까지 하락
- (2) 진행 시 상단 빨간색 추세선 부근인 7450$ 까지 상승
- (3) 진행 시 7040$ 까지 하락
- (4) 진행 시 7750$ 까지 상승
- (5) 진행 시 하단 빨간색 추세선 부근인 7300$ 까지 하락
- 다시(1) 진행 시 상단 파란색 추세선 부근인 8000$ 까지 상승
- (2) 진행 시 하단 빨간색 추세선 부근인 7480$ 까지 하락
- (3) 진행 시 13000$ 까지 상승
- (4) 진행 시 11700$ 까지 하락
- (5) 진행 시 12700$ 까지 상승
- 다시 (1) 진행 시 12000$ 까지 하락
- (2) 진행 시 12600$ 까지 상승
- (3) 진행 시 12200$ 까지 하락
- (4) 진행 시 17250$ 까지 상승
Three Wyckoff Laws
Wyckoff's chart-based methodology rests on three fundamental “laws,” which affect many aspects of analysis, including: determining the market's and individual stocks' current and potential future directional bias, selecting the best stocks to trade long or short, identifying the readiness of a stock to leave a trading range, and projecting price targets in a trend from a stock’s behavior in a trading range. These laws inform the analysis of every chart and the selection of every stock to trade.
The law of supply and demand determines the price direction. This principle is central to Wyckoff's method of trading and investing. When demand is greater than supply, prices rise, and when supply is greater than demand, prices fall. The trader/analyst can study the balance between supply and demand by comparing price and volume bars over time. This law is deceptively simple, but learning to accurately evaluate supply and demand on bar charts and to understand the implications of supply and demand patterns takes considerable practice.
The law of cause and effect helps the trader and investor set price objectives by gauging the potential extent of a trend emerging from a trading range. Wyckoff's “cause” can be measured by the horizontal point count in a point-and-figure chart, while the “effect” is the distance price moves corresponding to the point count. This law's operation can be seen as the force of accumulation or distribution within a trading range—and how this force works itself out in a subsequent trend or movement up or down. Point-and-figure chart counts are used to measure a cause and to project the extent of its effect. (See “Point and Figure Count Guide” below for an illustration of this law.)
The law of effort versus result provides an early warning of a possible change in trend in the near future. Divergences between volume and price often signal a change in the direction of a price trend. For example, when there are several high-volume (large effort) but narrow-range price bars after a substantial rally, with the price failing to make a new high (little or no result), this suggests that big interests are unloading shares in anticipation of a change in trend.
Analyses of Trading Ranges
One objective of the Wyckoff method is to improve market timing when establishing a position in anticipation of a coming move where a favorable reward/risk ratio exists. Trading ranges (TRs) are places where the previous trend (up or down) has been halted and there is relative equilibrium between supply and demand. Institutions and other large professional interests prepare for their next bull (or bear) campaign as they accumulate (or distribute) shares within the TR. In both accumulation and distribution TRs, the Composite Man is actively buying and selling, the distinction being that in accumulation, the shares purchased outnumber those sold, while in distribution the opposite is true. The extent of accumulation or distribution determines the cause that unfolds in the subsequent move out of the TR.
Wyckoff Schematics
A successful Wyckoff analyst must be able to anticipate and correctly judge the direction and magnitude of the move out of a TR. Fortunately, Wyckoff offers time-tested guidelines for identifying and delineating the phases and events within a TR, which in turn provide the basis for estimating price targets in the subsequent trend. These concepts are illustrated in the following four schematics; two depicting common variants of accumulation TRs, followed by two examples of distribution TRs.
Accumulation: Wyckoff Phases
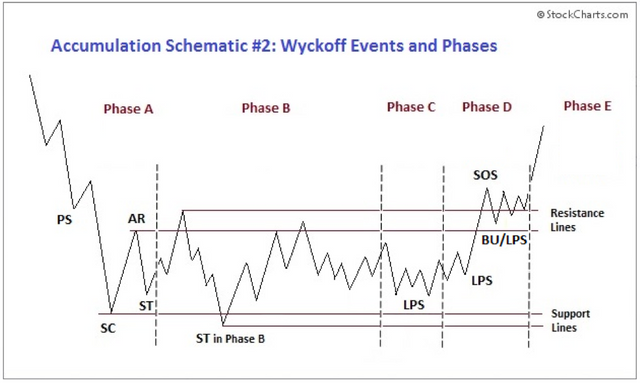
Phase A: Phase A marks the stopping of the prior downtrend. Up to this point, supply has been dominant. The approaching diminution of supply is evidenced in preliminary support (PS) and a selling climax (SC). These events are often very obvious on bar charts, where widening spread and heavy volume depict the transfer of huge numbers of shares from the public to large professional interests. Once these intense selling pressures have been relieved, an automatic rally (AR), consisting of both institutional demand for shares as well as short-covering, typically ensues. A successful secondary test (ST) in the area of the SC will show less selling than previously and a narrowing of spread and decreased volume, generally stopping at or above the same price level as the SC. If the ST goes lower than that of the SC, one can anticipate either new lows or prolonged consolidation. The lows of the SC and the ST and the high of the AR set the boundaries of the TR. Horizontal lines may be drawn to help focus attention on market behavior, as in the two Accumulation Schematics, above.
Sometimes the downtrend may end less dramatically, without climactic price and volume action. In general, however, it is preferable to see the PS, SC, AR, and ST, because these provide not only a more distinct charting landscape, but also a clear indication that large operators have definitively initiated accumulation.
In a re-accumulation TR (which occurs during a longer-term uptrend), the points representing PS, SC, and ST are not evident in Phase A. Rather, in such cases, Phase A during re-accumulation resembles that more typically seen in distribution (see below). Phases B – E in re-accumulation TRs are similar to, but are usually of shorter duration and smaller amplitude than, those in the primary accumulation base.
Phase B: In Wyckoff analysis, phase B serves the function of “building a cause” for a new uptrend (See Wyckoff Law #2 – “Cause and Effect”). In phase B, institutions and large professional interests are accumulating relatively low-priced inventory in anticipation of the next markup. The process of institutional accumulation may take a long time (sometimes a year or more), and involves purchasing shares at lower prices and checking advances in price with short sales. There are usually multiple STs during Phase B, as well as upthrust-type actions at the upper end of the TR. Overall, the large interests are net buyers of shares as the TR evolves, with the goal of acquiring as much of the remaining floating supply as possible. Institutional buying and selling imparts the characteristic up-and-down price action of the trading range.
Early on in Phase B, the price swings tend to be wide, accompanied by high volume. As the professionals absorb the supply, however, the volume on downswings within the TR tends to diminish. When it appears that supply is likely to have been exhausted, the stock is ready for Phase C.
Phase C: It is in phase C that the stock price provides goes through a decisive test of the remaining supply, allowing the “smart money” operators to ascertain whether the stock is ready to be marked up. As noted above, a spring is a price move below the support level of the TR established in phases A and B that quickly reverses and moves back into the TR. It is an example of a bear trap because the drop below support appears to signal resumption of the downtrend. In reality, though, this marks the beginning of a new uptrend, trapping the late sellers, or bears. In Wyckoff's method, a successful test of supply represented by a spring (or a shakeout) provides a high-probability trading opportunity. A low-volume spring (or a low-volume test of a shakeout) indicates that the stock is likely to be ready to move up, so this is a good time to initiate at least a partial long position.
The appearance of a SOS shortly after a spring or shakeout validates the analysis. As noted in Accumulation Schematic #2, however, the testing of supply can occur higher up in the TR without a spring or shakeout; when this occurs, the identification of phase C can be challenging.
Phase D: If we are correct in our analysis, what should follow is the consistent dominance of demand over supply. This is evidenced by a pattern of advances (SOSs) on widening price spreads and increasing volume, and reactions (LPSs) on smaller spreads and diminished volumes. During Phase D, the price will move at least to the top of the TR. LPSs in this phase are generally excellent places to initiate or add to profitable long positions.
Phase E: In phase E, the stock leaves the TR, demand is in full control, and the markup is obvious to everyone. Setbacks, such as shakeouts and more typical reactions, are usually short-lived. New, higher-level TRs comprising both profit-taking and acquisition of additional shares (“re-accumulation”) by large operators can occur at any point in phase E. These TRs are sometimes called “stepping stones” on the way to even higher price targets.
세가지 Wyckoff 법칙
Wyckoff의 차트 기반 방법론은 분석의 여러 측면에 영향을 미치는 세 가지 기본 "법칙"에 의존합니다. 즉, 시장 및 개별 주식의 현재 및 잠재적 방향성 편향성 결정, 장기 또는 단기 교역을위한 최고의 주식 선택, 거래 범위를 벗어나는 주식, 그리고 거래 범위의 주식 행동의 추세에 따라 목표 가격을 투사합니다. 이 법은 모든 차트의 분석과 거래 할 모든 주식의 선택을 알려줍니다.
수요와 공급의 법칙은 가격 방향을 결정한다. 이 원칙은 Wyckoff의 거래 및 투자 방법의 핵심입니다. 수요가 공급보다 크면 가격이 상승하고 공급이 수요보다 클 때 가격이 하락합니다. 상인 / 애널리스트는 시간과 가격을 비교하여 수요와 공급 간의 균형을 연구 할 수 있습니다. 이 법은 믿을 수 없을만큼 간단하지만, 가로 막 대형 차트에 대한 수요와 공급을 정확하게 평가하고 공급 및 수요 패턴의 함의를 이해하는 것을 배우는 것은 상당히 실용적입니다.
원인과 결과의 법칙은 거래 범위에서 나오는 추세의 잠재적 범위를 측정함으로써 상인과 투자자가 가격 목표를 설정하는 데 도움이됩니다. Wyckoff의 "원인"은 포인트 앤 피규어 차트의 수평 포인트 수로 측정 할 수 있지만 "효과"는 포인트 수에 해당하는 거리 가격 이동입니다. 이 법의 운영은 거래 범위 내에서의 축적 또는 분배의 힘으로 볼 수 있으며,이 추세가 후속 추세 나 위 또는 아래로의 이동에서 어떻게 작동 하는지를 볼 수 있습니다. 포인트 - 앤 - 피규어 차트 수는 원인을 측정하고 그 영향 범위를 투사하는 데 사용됩니다. (이 법에 대한 설명은 아래의 "포인트 앤 카운트 카운트 가이드"를 참조하십시오.)
노력 대 결과 의 법칙은 조만간 추세의 가능한 변화에 대한 조기 경보를 제공합니다. 물량과 물가의 차이는 종종 가격 추세의 변화를 의미합니다. 예를 들어, 가격이 새롭지 않고 (결과가 거의 없거나 전혀 없음) 상당한 액트가 발생한 후에 대용량 (큰 노력)이지만 좁은 범위의 가격 막대가있는 경우 큰 이익이 주식을 경향 변화 예상.
거래 범위 분석
Wyckoff 방법의 한 가지 목적은 호의적 인 보상 / 위험 비율이 존재하는 다가올 움직임을 예상하여 포지션을 수립 할 때 시장 타이밍을 개선하는 것입니다. 거래 범위 (TR)는 이전 추세 (위 또는 아래)가 중단되었고 수급간에 상대적 균형이있는 곳입니다. 기관 및 기타 대규모 전문 분야의 이해 관계자는 TR 내에서 주식을 축적 (또는 배포) 할 때 다음 번 황소 (또는 곰) 캠페인을 준비합니다. 누적 및 유통 TR 모두에서 Composite Man은 적극적으로 매매하고 있으며, 누적 된 주식은 판매 된 주식의 수보다 많으며 분배의 경우에는 그 반대가 사실입니다. 축적 또는 분배의 정도는 TR의 후속 이동에서 펼쳐지는 원인을 결정합니다.
Wyckoff 회로도
Wyckoff의 성공적인 분석가는 TR 밖의 이동의 방향과 규모를 예견하고 정확하게 판단 할 수 있어야합니다. 다행스럽게도 Wyckoff는 TR 내에서 위상 및 이벤트를 식별하고 묘사하는 데 시간이 많이 걸리는 지침을 제공합니다. 그러면 다음 추세에서 가격 목표를 추정 할 수있는 기반을 제공합니다. 이러한 개념은 다음의 네 가지 도식으로 설명됩니다. 두 가지는 축적 TR의 공통 변형을 묘사하고, 두 가지 배포 TR의 예가 뒤 따른다.
누적 : Wyckoff 단계
A 단계 :A 단계는 이전 하락세의 중지를 표시합니다. 지금까지는 공급이 지배적이었습니다. 공급의 다가오는 감소는 예비 지원 (PS)과 판매 클라이맥스 (SC)에서 입증됩니다. 이러한 이벤트는 막대 차트에서 종종 매우 분명합니다. 확산 및 대량 거래가 확산되면서 많은 수의 주식이 공공 분야에서 대규모 전문 분야로 옮겨가는 것을 나타냅니다. 이러한 강렬한 매도 압력이 일단 완화되면, 주식에 대한 제도적 요구뿐만 아니라 단기 채권으로 구성된 자동 랠리 (AR)가 일반적으로 발생합니다. SC 영역에서의 성공적인 2 차 시험 (ST)은 이전에 비해 판매량이 적고 스프레드가 줄어들고 볼륨이 줄어들며 일반적으로 SC와 동일한 가격 수준 또는 그 이상으로 중단됩니다. ST가 SC보다 낮아지면, 새로운 최저점 또는 장기간의 통합을 기대할 수 있습니다. SC와 ST의 최저치와 AR의 최고치는 TR의 경계를 설정한다. 수평선은 위의 두 가지 축적 도식 에서처럼 시장 행동에주의를 집중시키는 데 도움이 될 수 있습니다.
때로는 하락세가 클라이 막스 가격 및 대량 거래없이 덜 극적으로 끝나기도합니다. 그러나 일반적으로 PS, SC, AR 및 ST는 더 뚜렷한 차트 환경을 제공 할뿐만 아니라 대규모 운영자가 축적을 시작했음을 명확히 표시하기 때문에 PS, SC, AR 및 ST를 확인하는 것이 좋습니다.
재 축적 TR (장기간 상승 추세에서 발생)에서 PS, SC 및 ST를 나타내는 점은 단계 A에서 분명하지 않습니다. 이러한 경우 오히려 재 축적 중에 단계 A는 더 일반적으로 볼 수있는 점과 유사합니다 (아래 참조). 재 축적 TR의 단계 B-E는 1 차 축적 기저의 경우보다 유사하지만 보통 지속 기간이 짧고 진폭이 더 작다.
B 단계 :Wyckoff 분석에서 B 단계는 새로운 상승 추세에 대한 "원인을 구축하는"기능을 담당합니다 (Wyckoff Law # 2 - "원인 및 결과"참조). 단계 B에서 기관 및 대규모 전문 분야는 다음 마크 업을 예상하여 상대적으로 저렴한 재고를 축적하고 있습니다. 제도적 축적의 과정은 긴 시간 (때로는 1 년 이상)이 소요될 수 있으며, 낮은 가격으로 주식을 구입하고 짧은 판매로 가격의 진보를 확인하는 것을 포함합니다. 일반적으로 위상 B 중에는 다수의 보안 목표 명세서가 있으며, 보안 목표 명세서의 상단에는 위도 (suprastrust) 유형의 행동이있다. 전반적으로, 큰 관심사는 TR이 진화함에 따라 주식의 순 구매자이며 가능한 한 잔여 부동 공급 물량을 최대한 확보하는 것을 목표로합니다. 기관 매매는 거래 범위의 특징적인 상하 가격 행동을 부여한다.
B 단계 초기에 가격 변동폭이 크고 대량 생산이 수반됩니다. 그러나 전문가가 공급을 흡수함에 따라 TR 내에서의 다운 스윙의 양은 감소하는 경향이 있습니다. 공급이 고갈 될 것으로 보이면 주식은 Phase C 준비가 완료됩니다.
C 단계 :주가가 제공하는 것은 C 단계에 있으며 남은 공급에 대한 결정적인 테스트를 거쳐 "스마트 머니"운영자가 주식 준비를 할 준비가되었는지 여부를 확인할 수 있습니다. 위에서 지적했듯이, 봄은 A와 B 단계에서 수립 한 TR의 지원 수준보다 낮은 가격으로 물러나 신속하게 되돌아와 TR로 되돌아갑니다. 그것은 지원 아래의 하락이 하락세의 재개를 신호하는 것처럼 보이기 때문에 곰 함정의 예입니다. 그러나 현실적으로 이것은 새로운 상승 추세의 시작을 의미하고, 늦은 판매자 또는 곰을 붙잡습니다. Wyckoff의 방법으로 봄 (또는 shakeout)에 의해 표현 된 공급의 성공적인 테스트는 높은 확률의 거래 기회를 제공합니다. 소량의 용수철 (또는 소량의 용적 테스트)은 재고가 올라갈 준비가되어 있음을 나타내며,
SOS가 봄이나 shakeout 직후에 나타나 분석의 유효성을 확인합니다. 그러나 Accumulation Schematic # 2에서 언급했듯이 공급 시험은 스프링이나 shakeout없이 TR에서 더 높게 발생할 수 있습니다. 이것이 발생하면 C 단계의 식별이 어려울 수 있습니다.
D 단계 : 우리가 분석에서 옳은 것이라면, 공급에 대한 수요의 일관된 지배가 뒤따라야합니다. 이는 가격 스프레드의 확대와 볼륨의 증가, 더 작은 스프레드 및 감소 된 볼륨의 반응 (LPS)에 대한 진보 패턴 (SOS)에 의해 입증됩니다. D 단계에서 가격은 적어도 TR 상단으로 이동합니다. 이 단계의 뇌 보호 시스템은 일반적으로 수익성이 좋은 긴 직책을 시작하거나 추가 할 수있는 훌륭한 장소입니다.
E 단계 : E 단계 에서 주식은 TR을 벗어나 수요는 완전히 통제되며 모든 사람에게 인상적입니다. shakeouts 및보다 일반적인 반응과 같은 방해는 일반적으로 수명이 짧습니다. 새로운 운영체제에 의한 이익 분배 및 추가 주식 획득 ( "재 축적")을 포함하는 새롭고 상위 수준의 거래소는 E 단계의 어느 시점에서나 발생할 수 있습니다. 이러한 TR은 때로는 더 높은 수준으로가는 도중에 "디딤돌 (stepping stone)" 이라고도 합니다 가격 목표.