Analysis of bitcoin exchange rate for a week.

May 4-May 10
During the last week, trading was conducted in a narrowing range above $7000. Cryptocurrency managed to stay around $7200-7400, and the closure was above the level of 23.6% Fibonacci retracement from a high of $8613 to a low of $7050. These are positive signs, but the positive dynamics of the exchange rate will certainly face difficulties in the area of $7800.
In this area, on the four-hour chart of the BTC/USD pair, the resistance of the downtrend line and 50% of the Fibonacci retracement from the maximum of $8613 to the minimum of $7050 was formed. If the bulls manage to push the rate above $7800, then the cryptocurrency will have a chance to reach the $8000 mark again and go further.
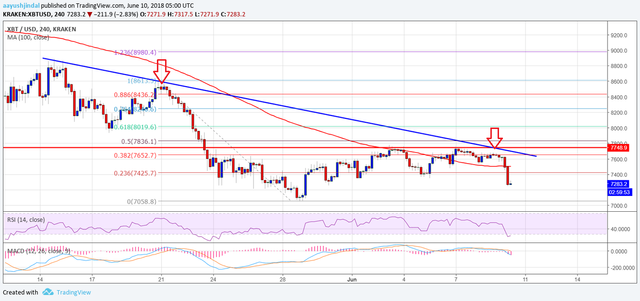
At the same time, if the bears are able to break the support of $7200, we can expect a negative reaction of the rate, until the return of the February lows in the area of $6000.
Indicators
Convergence / divergence of moving averages (MACD) on the four-hour chart BTC/USD is neutral, there is a small transition to the bullish zone. Relative strength index (RSI) is located just below 50.
The main support level is $7,200, resistance - $7800.
Go here https://steemit.com/@a-a-a to get your post resteemed to over 72,000 followers.