Crypto - Is the party about to begin again?
It's been painful to be a crypto investor for the last 9 months, but that may be about to change.
Since peaking in December of 2017, bitcoin has mostly gone down.
Altcoins, including steem, experienced a euphoric rally shortly after in January of 2018, but ever since it has been mostly all down hill as well.
However, that all may be about to change...
Why might I say that you may be wondering?
Seasonality!
There seems to be some major seasonality to bitcoin and crypto trading.
We all know about the negative seasonality that seems to happen at the beginning of the year related to the Chinese New Year and also tax related selling, but there is also some majorly positive seasonality towards the end of the year as well.
Not sure exactly what I am talking about?
Check this chart out:
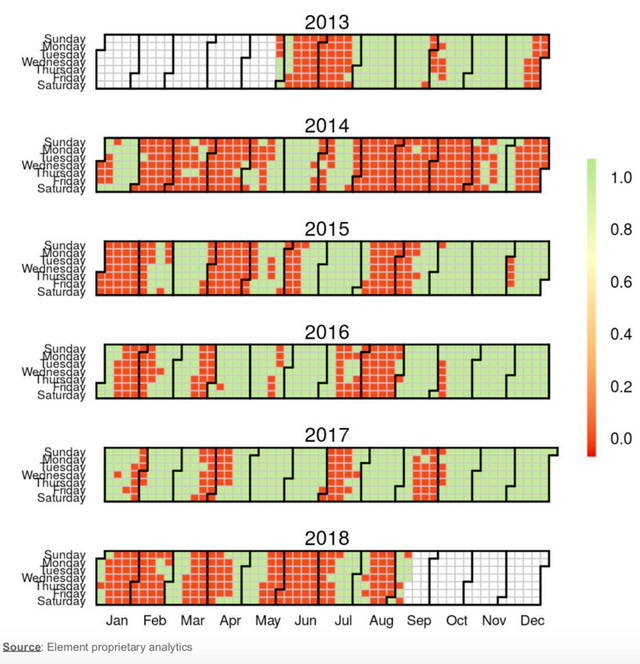
Not sure what you are looking at here? Don't worry, I'll explain.
Each block represents a day.
Each green block represents a day that bitcoin had an increase in price.
Each red block represents a day that bitcoin had a decrease in price.
Simple enough, right?
Take a look at that 4th quarter...
Since 2015, over the last 3 years, bitcoin has had 14 red days during the 4th quarter, COMBINED!
Let that sink in for a moment, there are 3 months in a quarter and we are dealing with 3 years of data, which gives us roughly 92 days multiplied by 3 years, or 276 days worth of data points.
Out of those roughly 276 days, only 14 of them were red over the past 3 years.
That means that 95% of the days in the 4th quarter have been green over the last 3 years.
Talk about a good time to be a bull!
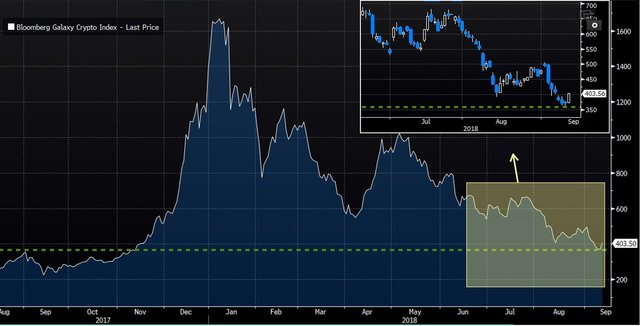
Oh yea and then there is this...
Today, Mike Novogratz is calling the bottom in the crypto markets:
(Source: https://twitter.com/novogratz/status/1040288811643809798)
At this point, the parabolic portion of the bull cycle has been completely erased, something Novogratz said likely represents a bottoming out point in the crypto markets.
He also called the top back in December, he's a smart guy and a good one to pay attention to.
When you combine his call with the strong seasonal period we are about to enter, I think there is very high probability that the party is about to begin again in crypto land.
Stay informed my friends.
Image Source:
https://altcointoday.com/biggest-influencers-bitcoin-price-2016/
Follow me: @jrcornel
Cool stats but you've reported on it incorrectly.
The correct stats is what's below, and I wouldn't be surprised if we'd see a repeat of that trend this year. I'd be surprised if we didn't.
The wording of that is very strange. For example why would they say the prior 4 weeks of data is represented in the following block, but then later on say there has only be 14 red "days"? The correct verbage should be there have only been 14 red "blocks", because technically there were likely more than 14 actual red "days". Thanks for pointing that out, though I wish the data was what I had reported instead. ;)
Haha! You're right! Good catch! I wish yours what right too but I had read it correctly first then read yours and didn't realize your mistake which I then repeated to a couple of people.
I then consciously realized something was off when I looked at the last 3 months of 2017 and saw more than 14 "negative" days for Bitcoin in that year alone.
Yep, there you go, too bad I can't edit that post now... sigh... at least not yet anyways. :)
I was 150% confident that this would happen earlier this year, but now I wonder if we'll see an anomaly, similar to what is shown for 2014. However, we've been bearish for a while and there is way more going on in the crypto space these days. I'd guess it's more likely to see some bullish action across the boards than to keep floundering, especially because I suspect there's been a lot of price manipulation by whales during the past months to acquire some cheap crypto before the next inevitable explosion :-D
Yes, there is 2014 to consider, especially since most of the price action up to now for 2018 closely resembles that year as compared to others. That being said, in general, the 4th quarter is often a good time to be long crypto, with only a few outliers like in 2014.
That "outlier" in 2014 is the most important piece of data. The market has a way better chance of going that route because the 2017 pump/dump was similar to the 2013 pump/dump.
Obviously, I hope I'm wrong... but I feel like this post is extremely biased and full of wishful thinking. I've been guilty of the same move on multiple occasions... thought there was going to be another bull run in the summer.
It's not wishful thinking, it's just called using selective data to make an argument. ;)
In all seriousness though, even if you include the last 5 years, the entire chart, it still makes the 4th quarter overwhelmingly bullish on average. With 2014 being the only negative one.
Though like you said, that one might be the most applicable to the current environment.
However, when you combine that seasonal data with the fact that the crypto markets have now erased all of the euphoric price action starting in late 2017, it may also give credence to the possibility of bullish price action ahead.
We will know for sure in just over 3 months time.
Obviously I drew this a while back... but Bitcoin has amazingly stayed inside the parabola. There is still a chance it could complete it by the end of the year. If you look at the 2013/2014 pump/dump the parabola was broken pretty much in the month of September/October. I guess we're close to finding out.
Do or die time. If it breaks down, it looks like we won't see bullish price action till roughly June of 2019 if it were to follow the pattern of the 2014-2015 bear market.
If you want to resteem or wanna upvote your post and want to promote your post, you can send 0.5 SBD to @steemvive and give that post link in memo, then it will be get upvote from our groups and 100% payment back if you won't get back. Steemvive gives you more back than you want. we have 20k followers in our group and many delegates. so don't worry to upvote your post.
Our website is coming soon....
Let the Party begin! 🎉 🎊 🎈
Damn. Bitcoin be better than Tom Brady and Russel Wilson combined in the fourth quarter!
Haha nice analogy. But yes, it has been, at least over the past 3 years.
I hope both you and Mike are right!! Just remind me to sell at the end of December!!
I however note that this year has a lot more reds than the other years, although it looks very similar to the 2015 pattern, which has the green starting at the end of September, in other words about next week!!
Very true, though I think it actually most closely resembles that of 2014, which if that is indeed the case, we won't get much of a 4th quarter rally. I am hoping this time is different though, dangerous last words. :)
Let us hope for the best!!
Unfortunately, past results do not necessarily forecast future performance... However, I do believe that the demand for most of the blockchain related assets remains high and the problem lies with the amount of assets still out there that have not added assets which are dragging down sentiment of the overall market. The next bull run will highlight the divergence of quality assets only!
While that is a very good point and certainly true, there is something to be said about seasonality as it relates to crypto. As you know, crypto doesn't really have any fundamentals. No earnings no balance sheets, no dividends. It is driven purely by animal spirits. Which in my opinion, would make seasonality patterns slightly more prevalent and predictable than they would be in something that wasn't driven quite so much by human emotion. Just my thoughts. :)
better not 2014!!!
It may be! The price action up to now most closely resembles that year...
Certainly the crypts have changed in many ways not only the world economic reality but also the lives of many of us, thanks to this a new world of possibilities opens before us and allows us to develop in ways that we had never before imagined, for its This requires investment and work but it's worth it.
Yes, hopefully.
Its been very painful journey indeed over the last few months.
Hopefully cryptos follow the seasonality and bring cheers
Being An Investor You can go through bearish & bullish , The one who have patience can win the battle.
Yep. Crypto moves in cycles. You buy and hold during the bearish cycles and you take profits during the bullish cycles.
Easy to say & difficult to implement because of greediness.