XMRUSD - Technical Analysis October 26, 2017 - Current Price $ 87.60

XMRUSD
Bitcoin is ripping again, and we should still be looking to the alt coins for opportunities. We had been tracking XMR some time ago, observing a wedge formation that ultimately manifested into nothing and the price trended sideways. This sort of price action while boring demonstrates price stability and strength in this range as a supply and demand zone.
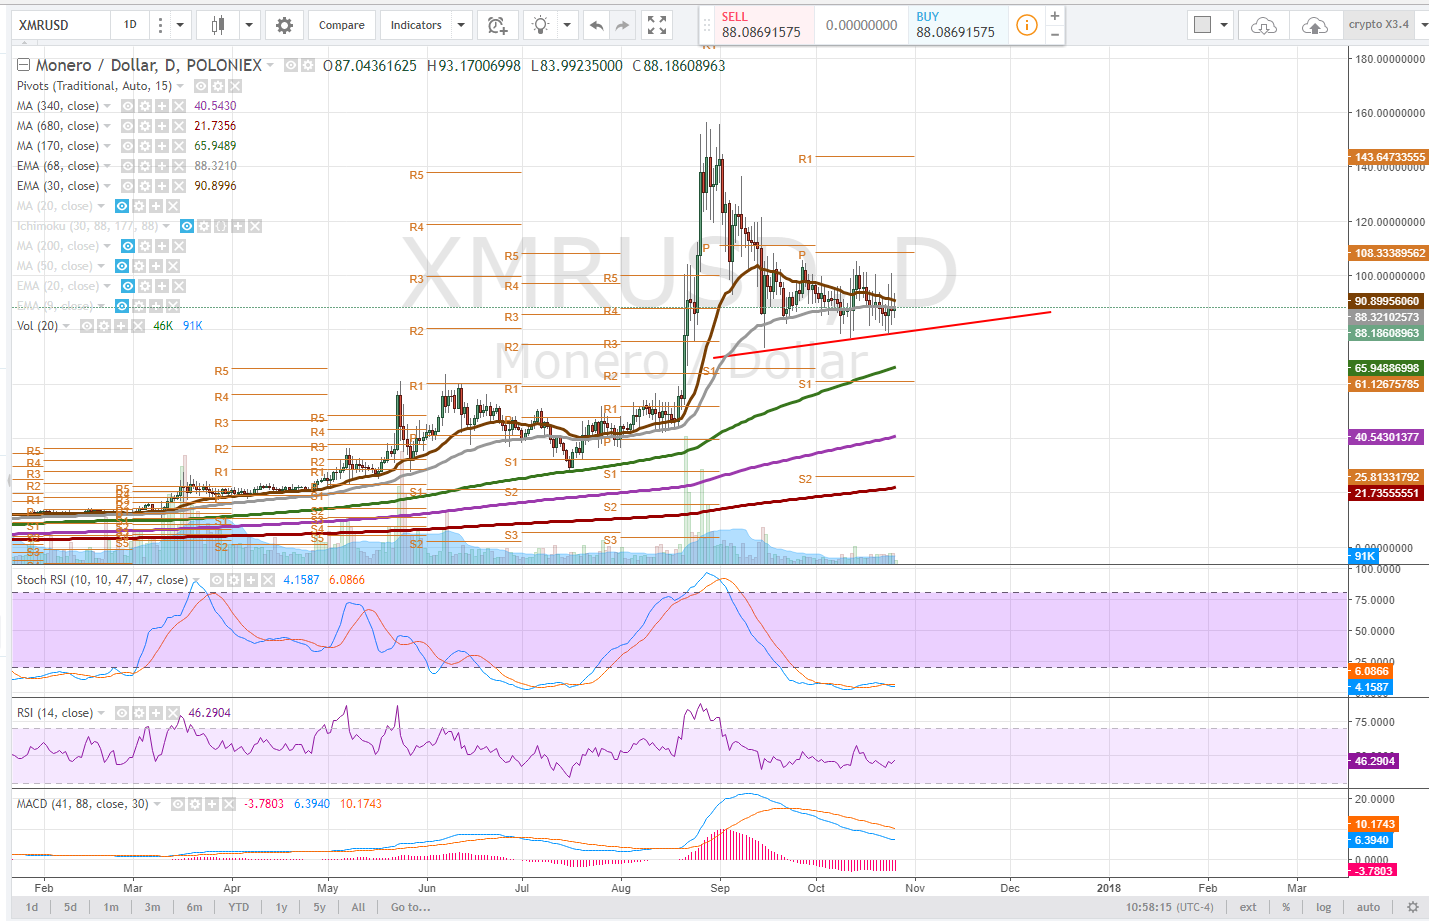
Daily
On the daily time frame some trendline support is observed as the price tracks relatively sideways. The 30ema is moving towards a convergence with the 68 ema where the price now rests. Consolidating on the 68ema will confirm it as support or resistance depending on the ultimate direction the price moves.
The stochastic RSI has been in a downtrend for some time with the MACD now approaching the zero line and the RSI flattening over this period in a more neutral range.
The price is still well above other major moving averages. Bulls would like to see the price reclaim the 39ema and test pivot resistance approximately $108. If the price regresses holding this trendline (approximately $80) is critical or a test of the 170dma ($65.94) on this time frame is possible.
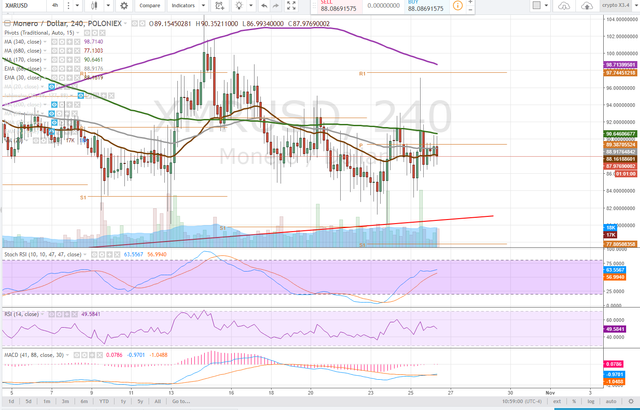
4 hour
On the 4 hour time frame, the price is testing pivot resistance and the 170dma. It is range bound for now and ignoring some candlestick wicks a possible pennant formation can be drawn with the apex nearing as the price range gets tighter and tighter - this is indicative of a move, the direction is not denoted and simply a function of probabilities based on chart conditions.
The stochastic RSI is trending upwards and if volume continues to increase the bullish MACD cross that has just occurred may begin to accelerate. Notice the RSI does have baseline support at approximately 40. Any test of this level will be critical to hold and would align with a retest of our trendline on a pullback.
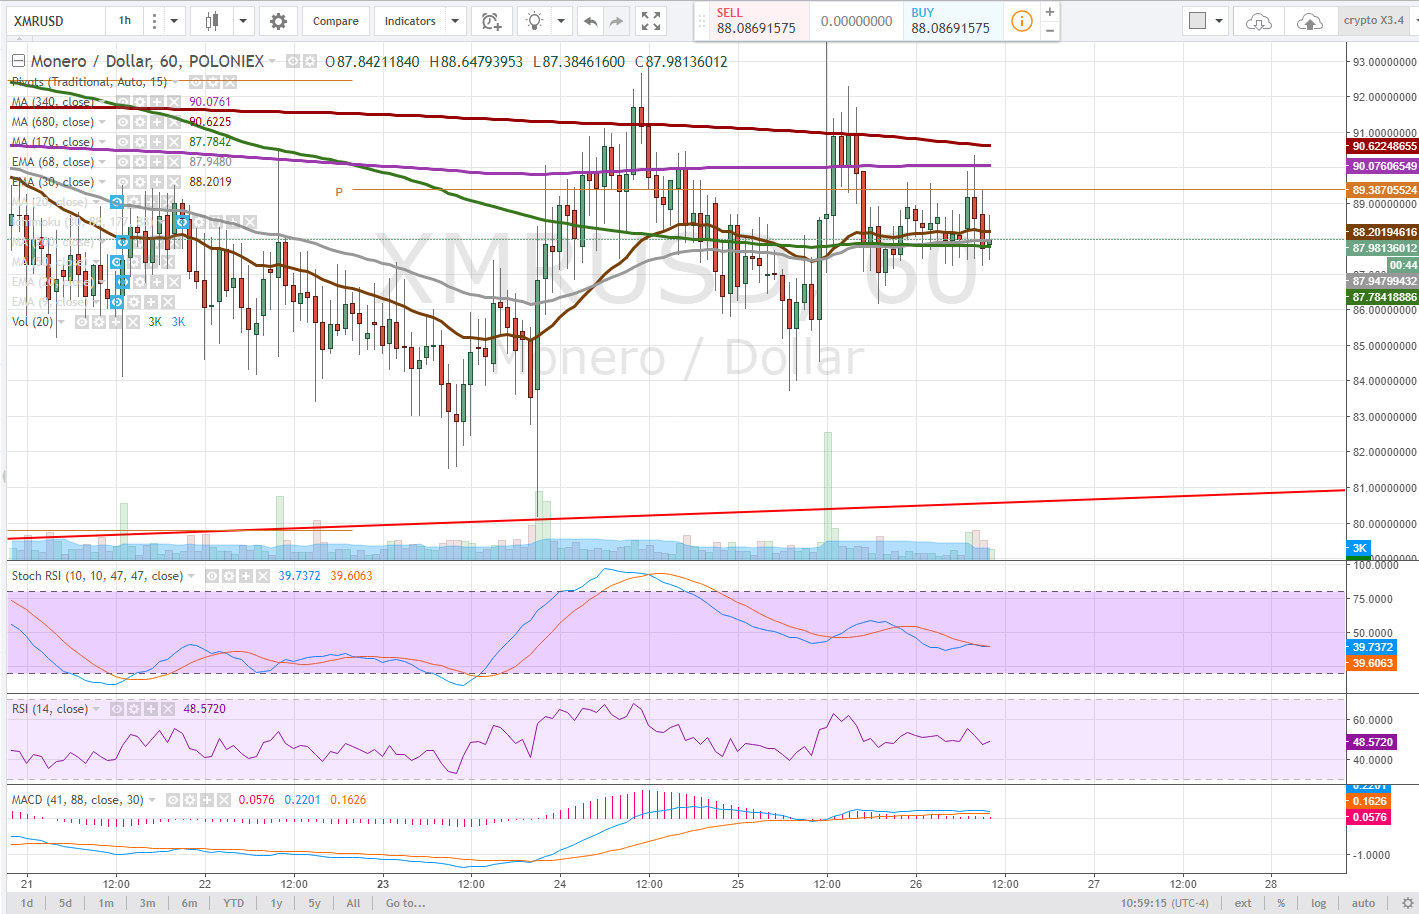
1 hour
The 1 hour time frame is most interesting to me with the price working on a week bullish cross of moving averages, the 30 & 68ema above the 170dma. If the price can confirm the 170dma here as support, price progression can begin given the possible pennant formation that could be drawn on this chart.
The MACD is trending sideways just above the zero line and it would be important to see it maintain this level as price consolidation continues. The stochastic RSI is trending downwards but is constantly trying to curl back up, suggesting intermittent buying pressure which can also be observed in all of the candlesticks as they are more wick than a body.
Bullish Above: $91
Bearish Below: $80
RISK TRADE: Caution is warranted for either side of the trade with Bitcoin showing serious price resilience. Scale into a long position up to trendline. If the price falls below close the position.
Don't forget to use stop losses!!!
Previous Articles:
ZECUSD
LTCUSD
BTCUSD
ETHUSD
BTCUSD
LTCUSD
XMRUSD
Follow at your own risk, Not a financial adviser, understand the risks associated with trading and investing. Manage your own Risk - in other words you could lose it all and it's your own fault.

Great expalnation and good post
Great expalnation and good post
Upvoted. I'll be resteeming this now :]
thanks Stanley!
So in general it's in an upward trend, am I correct ?
Thanks so much for this professional analysis.
If we look long term yes, XMR is in a long term uptrend, as are most of the major cryptocurrencies. The recent downtrend has become trendless. Traders and investors, the more affluent, look for basing and that is what we are observing here. So there are now thresholds (bearish below, bullish above) that the risk averse of us would look for before taking a position.
Thanks mate for your great explanation, I would be happy if you visit my last post it's so exciting you will love it.
I like XMR, but I'm going to invest in ZenCash too, "similar" to XMR but a low-marketcap coin
great post. thanks @jerrybanfield
great post. thanks @jerrybanfield
yes its an upward trend.
Good job you have here.. How much do you charge for 3 - 5 mins video ads please? Thanks
what do you mean? To make ads? or host ads?
Good job you have here.. How much do you charge for 3 - 5 mins video ads please? Thanks