Crypto-Education Series Episode 14 [EN-TR]
In this episode, we will examine Double Tops and Double Bottoms chart patterns. Until this episode, in 13 Crypto-Education Episodes, we discussed some specific indicators that are frequently used. From that time on, the series will continue with some specific formations and chart patterns.
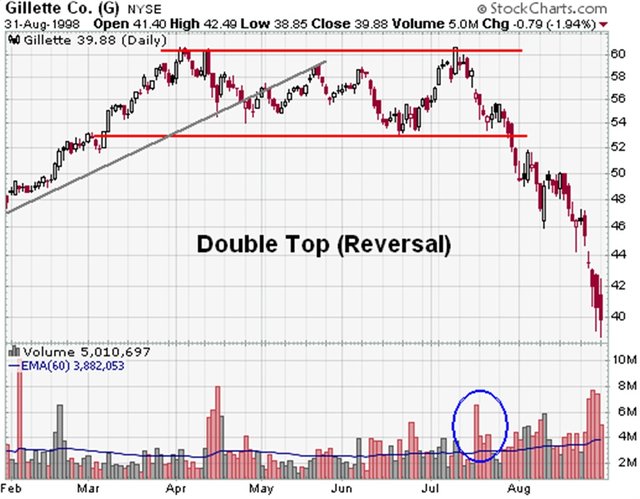
Double Tops
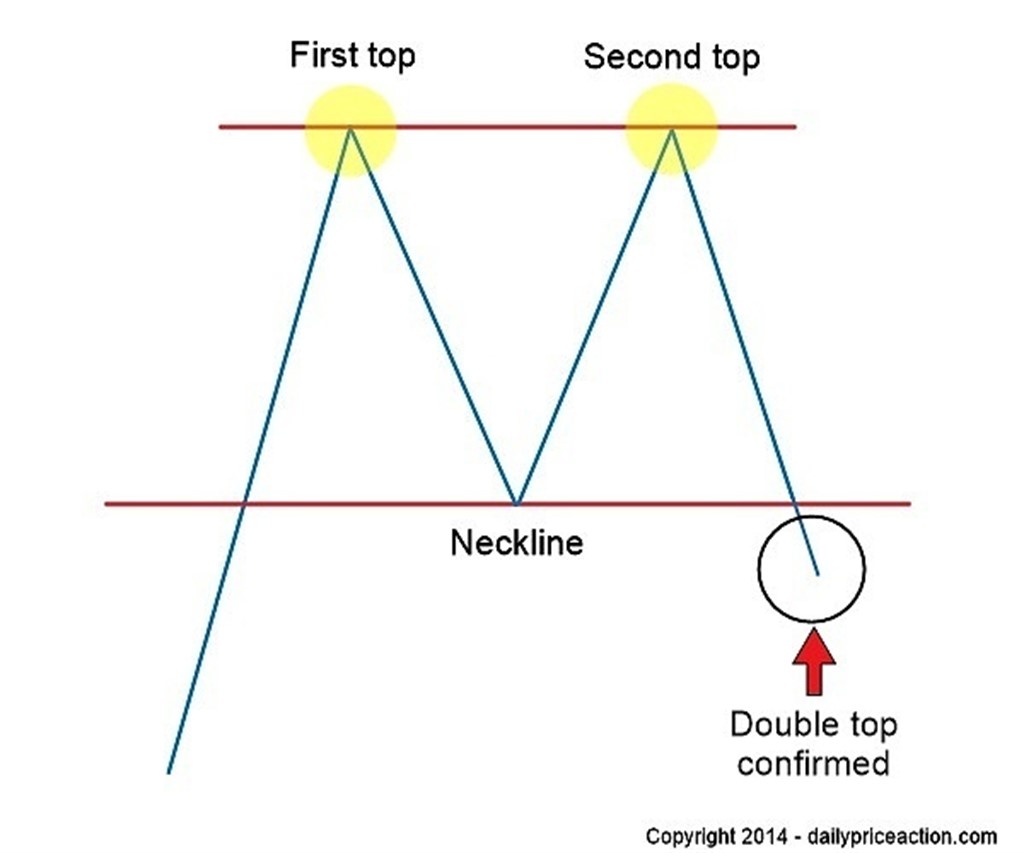
- Double Tops pattern is a reversal chart pattern.
It signals that the price action could not break through a certain price level. Briefly, the price tries to break the level twice, if it can not reach a higher level, then it pulls back and falls below the double tops channel.
- A double top forms when the price reaches a high level within an uptrend and then pulls back. In the next time, the price peaks near to the prior highest level, after that it falls below the pullback low.
The formation of a double top may demonstrate that a downtrend is forthcoming.
 protrader

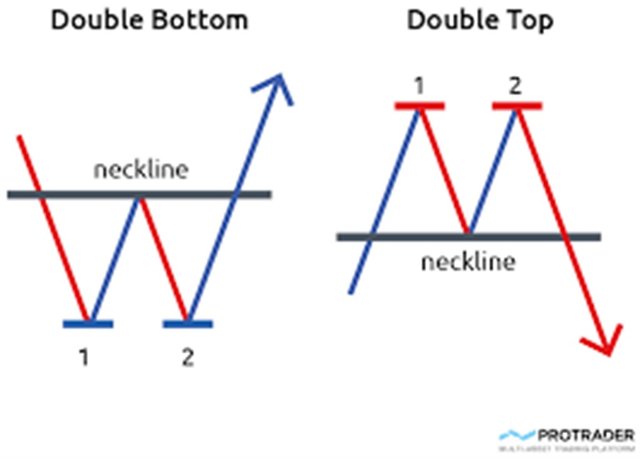
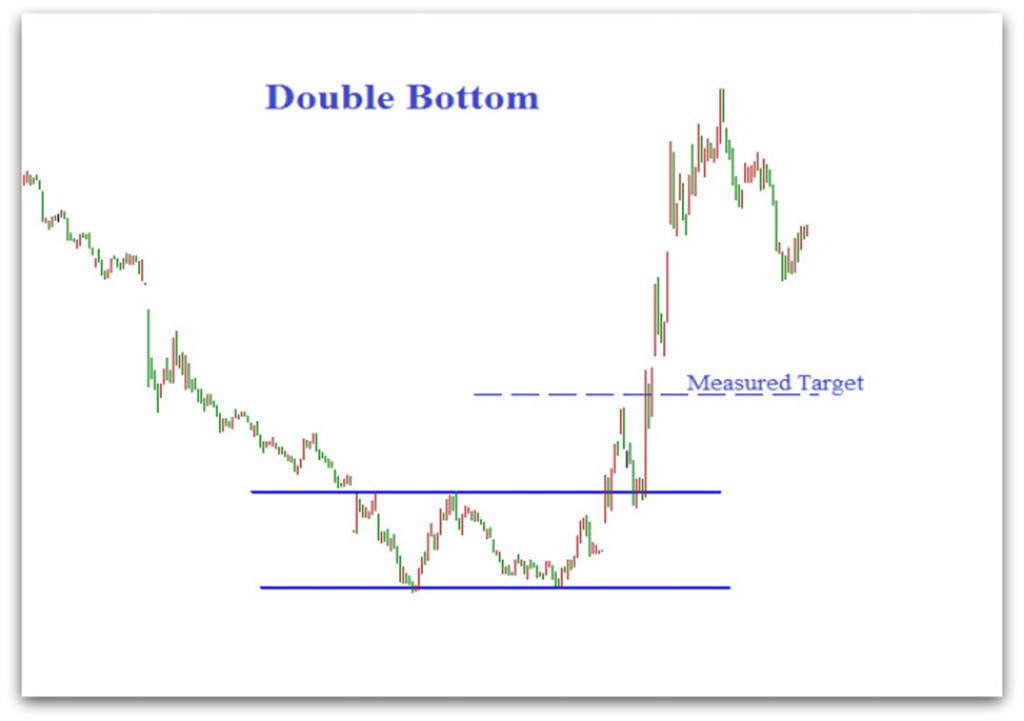
Double Bottoms
Double bottoms pattern is also a reversal chart pattern.
Double Bottoms pattern acts exact opposite to Double Tops.
Simply, once the price action could stand at a certain price level, though the level is tested twice, and bounce out of the small double bottoms channel, the formation is verified.
 forexfunction

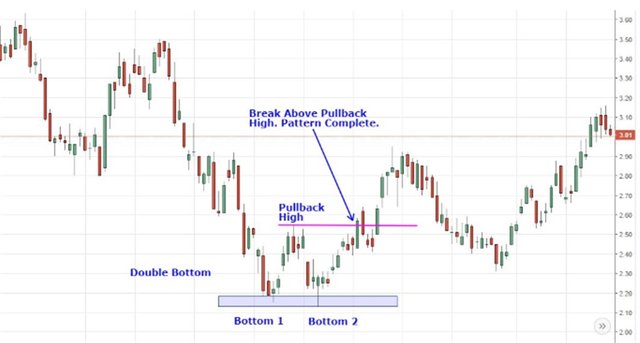
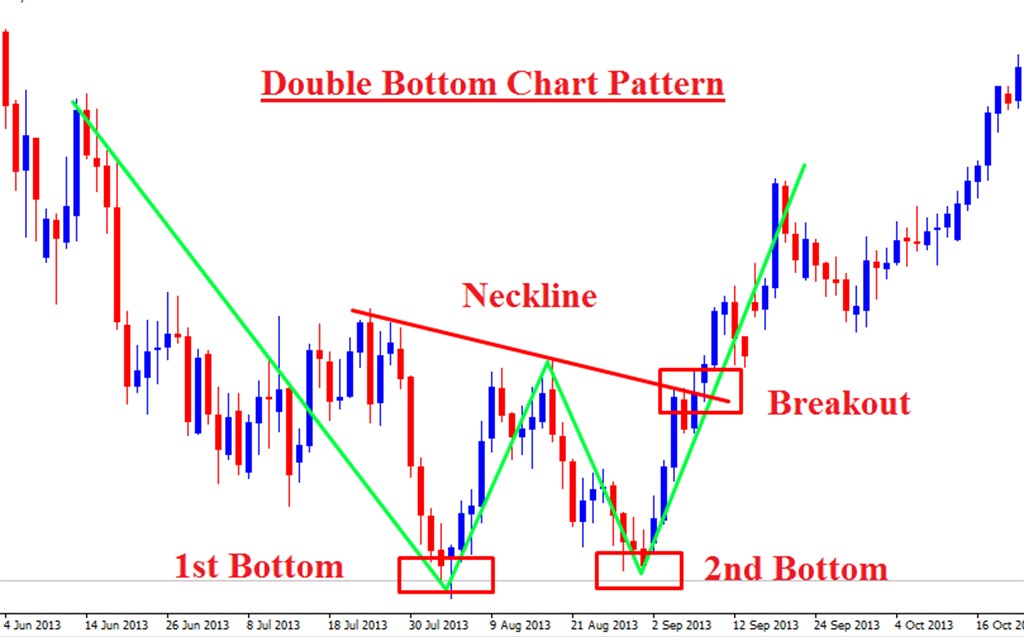
A double bottom forms when the price forms a low in a downtrend and pulls back to upwards. In the second test, the price falls on near to the prior low, afterward, it rallies above the pullback high which was formed in a double bottoms channel.
tradersdaytrading
To sum up, I want to quote a short paragraph from Investopedia in which the frequency and the importance of these patterns and the sentiments of traders are mentioned.
No chart pattern is more common in trading than the double bottom or double top. In fact, this pattern appears so often that it alone may serve as proof positive that price action is not as wildly random as many academics claim. Price charts simply express trader sentiment and double tops and double bottoms represent a retesting of temporary extremes. If prices were truly random, why do they pause so frequently at just those points? To traders, the answer is that many participants are making their stand at those clearly demarcated levels. Investopedia
Crypto-Education Series Episode 1
Crypto-Education Series Episode 2
Crypto-Education Series Episode 3
Crypto-Education Series Episode 4
Crypto-Education Series Episode 5
Crypto-Education Series Episode 6
Crypto-Education Series Episode 7
Crypto-Education Series Episode 8
Crypto-Education Series Episode 9
Crypto-Education Series Episode 10
Crypto-Education Series Episode 11
Crypto-Education Series Episode 12
Crypto-Education Series Episode 13
TURKISH
Bu bölümde, Çifte Tepeler ve Çifte Dipler grafik şablonlarını inceleyeceğiz. Bu zamana kadar 13 Kripto-Eğitim Bölümümüzde, sık kullanılan göstergeler konularına değindik. Bu bölüm ile beraber, bazı önemli grafik şablonları ve formasyonlar konularına değineceğiz.
Çifte Tepeler
- Çifte Tepeler bir geri dönüş şablonudur. Diğer bir değişle, çifte tepelerin oluşumu bize trend değişimi hakkında ipuçları sağlar.
- Fiyatın belirli bir seviyeyi kıramadığını gösterir.
- Kısaca ve basit bir dille, fiyat bir seviyeyi kırmak için iki defa o seviyeyi zorlar, ancak fiyatın bir seviyeyi kıramaması gücünü yitirmesine neden olur. Eğer fiyat o seviyenin üzerinde kalamazsa, oluşan küçük çifte tepeler kanalından aşağı yönde kırar.
 Stochcharts
- Çifte Tepelerin oluşumu, fiyat yukarı yönde bir trend içerisindeyken(uptrend) yüksek bir seviyeye ulaşıp, bir ger çekilme hareketi gösterir. Ardından, fiyat ikinci sefer o seviyeyi kırmak için dener ancak başarısız olursa geri çekilme seviyesinin de aşağısına düşer ve trend değişimi yaşanabilir.
- Çifte Tepeler şablonunun gerçekleşmesi,düşüş trendine(downtrend) geçişin göstergesidir.
protrader
Çifte Dipler
- Çifte Dipler de bir geri dönüş şablonudur.
- Çifte Tepelerin tam tersi diye nitelendirebiliriz.
- Basitçe, fiyat belirli bir düşük seviyeyi iki defa test eder ancak o seviyede güçlü bir destek bulursa, yönünü yukarı çevirir. Küçük Çifte Dipler kanalından dışarı sıçraması ile formasyonun başarıyla tamamlanması gerçekleşir.
forexfunction
- Çifte Dipler şablonu, ilk aşamada fiyatın düşüş trendinde bir düşük seviyeye ulaşması ardından yukarı yönde ufak bir sıçrama yapması ile şekillenmeye başlar. Sonrasında, fiyat ikinci kez o seviyeyi test eder ve altına düşmez ise, destek seviyesinin kırılamaması sayesinde fiyat yukarı yönde ilerler. Geri çekilme hareketi yaptığı seviyenin de üzerine çıkarak yukarı yönde trend başlangıcının habercisi olabilir.
tradersdaytrading
Sonuç olarak, Çifte Tepeler ve Çifte Dipler grafik şablonları karşımıza en çok çıkan şablonlardandır. Bize Trend değişimi ile ilgili olası bilgiler sağlamasının yanı sıra, alım-satım yapan kişilerin sahip olduğu stratejileri hakkında da bilgi sağlar. Bu şablonlardan yararlanırken, kullanabileceğimiz gösterge ve mümkünse fiyat şablonların da yararlanmakta her zaman fayda vardır.
Congratulations @agathusia! You have completed some achievement on Steemit and have been rewarded with new badge(s) :
Click on the badge to view your Board of Honor.
If you no longer want to receive notifications, reply to this comment with the word
STOPDo not miss the last post from @steemitboard!
Participate in the SteemitBoard World Cup Contest!
Collect World Cup badges and win free SBD
Support the Gold Sponsors of the contest: @good-karma and @lukestokes