3 Trends to Follow when Trading Cryptocurrencies
When trading cryptocurrencies it is obvious and essential to take a close look at candle charts of the price and volume charts in order to do technical analysis and make predictions. Many traders also benefit from indicators such as MACD, RSI and other studies. The order book might also give you some insight. All this data is based on the price, the volume and the orders that are made. While these methods are very valuable, the price of cryptocurrencies is also strongly influenced by factors such as news, popularity and hype.
In this article I will show you three indicators of these trends that can help you in getting more knowledge about a cryptocurrency and where the price might be heading to.
Google Search Trend
A very important indicator is the Google Search Trend. When the popularity of a cryptocurrency is growing, people will search for information about this coin, for example where to buy it, or what the blockchain project is about. When more people are investing, the amount of Google search queries will increase and the value of the altcoin will rise. When fewer people are investing the search trend will decline and the price will drop.
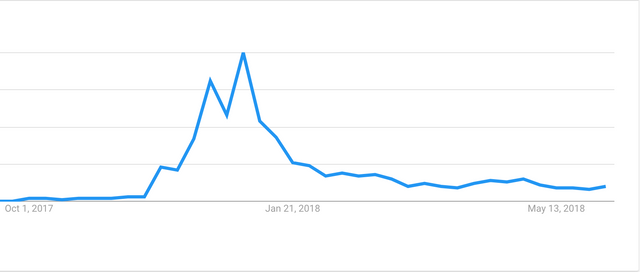
In the chart above the Google Search Trend for Cardano ($ADA) is shown. At the end of September 2017 the Mainnet was launched, and the interest began to rise. In the months thereafter new listings on exchanges where followed by articles that Cardano would be the next big thing (which it more or less turns out to be, considering the Market Cap rank), and the Google Search Trend rose to it’s high at the end of 2017. It might not surprise you that the price followed this trend.
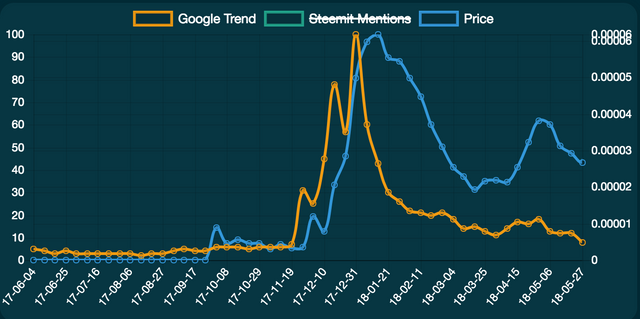
This chart (taken from Cryptoboard.tech) shows the Google Search Trend together with the price of $ADA over the period of a year. What is interesting to see, is that the search trend clearly correlates with the price and even precedes the pump to it’s ATH of 0.00008450 BTC ($1.33) on 2018/01/04. Before this date the Google Trend started to decline, just like the price.
Mentions on Steemit
Since Steemit.com is a social media platform built on the blockchain, naturally cryptocurrency trading is a very prominent subject you’ll find here. When people search for a coin often, you would expect that people also talk and publish frequently about this cryptocurrency. The behaviour turns out to be a bit different, but still can give you some unique insights.
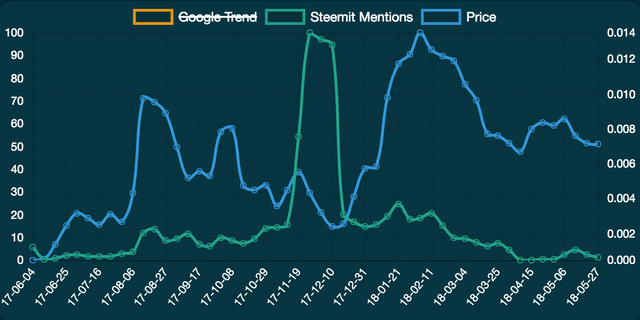
In this chart, the amount of mentions on Steemit (relative to itself on a scale of 0 to 100 during the period of a year) of NEO is compared with the price. After the surge in August 2017, the price of $NEO began to fall. Nonetheless, because so many traders invested in this currency and were still hoping for a next bull run, there apparently was a lot of attention for this platform. When the price was almost back at the level of July, the interest was higher than ever. A few weeks later the price started to surge again, to it’s ATH. While this chart doesn’t show a clear and direct correlation between mentions on Steemit and the price such as with the Google Trend, it still can give an indication of a cryptocurrency’s status.
Twitter Mentions
Another trend that does shows a very clear correlation with the price is the amount of mentions of an altcoin on Twitter. When using the web interface of Twitter, it can be hard to estimate the popularity of a cryptocurrency. Of course, many users are shilling coins they invested in themselves, which can be very misleading. The frequency of tweets about a coin without considering the content however can give you an indication if something is happening.
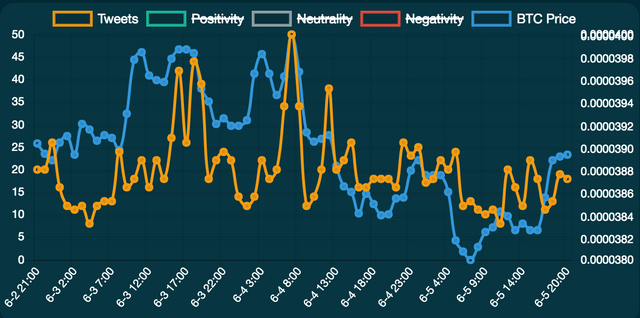
This chart shows the amount of tweets that mention VEN (VeChain), together with the price during the last three days. As can be seen, the correlation is very direct. When the price is rising, the amount of tweets tends to increase immediately. It is hard to connect a trading strategy with this chart, since a growing trend does not always precede a rising price. But it is a cool visualisation and might be of help.
Please take a look at cryptoboard.tech for real-time versions of these and other comparable charts for more than 20 popular cryptocurrencies.
Coins mentioned in post:
Congratulations @ariov! You received a personal award!
You can view your badges on your Steem Board and compare to others on the Steem Ranking
Do not miss the last post from @steemitboard:
Vote for @Steemitboard as a witness to get one more award and increased upvotes!