Latest Litecoin (LTC) price prediction – bullish chart & analysis
Litecoin is and has been outperforming the top market cap cryptocurrencies. Litecoin is a barometer or the altcoin sector and generally signals when some major/minor moves may happen.
Litecoin has just crossed a major resistance level
On every chart and every instrument that can be traded and be represented on a chart, there are certain number values that represent important support and resistance levels. The more traditional and common way to define support and resistance is to use recent major and minor swing highs and lows. While there is nothing wrong about that process, it is nearly impossible to predict what future important price ranges are. There are specific ‘harmonic’ numbers that exist and they, for whatever reason, create the most natural and major support/resistance levels for any instrument on the planet. And each of those particular harmonic levels are the absolute strongest areas for traders to push price above or below. And Litecoin has just crossed one of those levels on Friday.
The 1/8th Major Harmonic Level
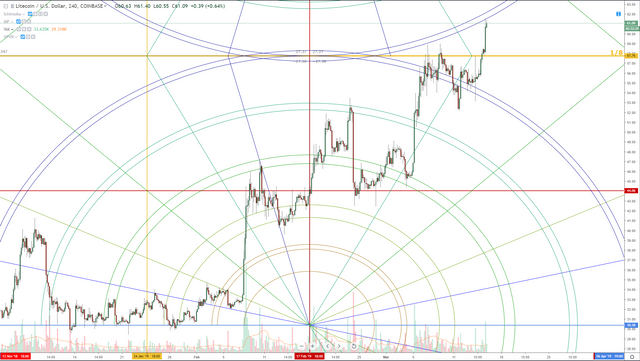
The 1/8th Major Harmonic level is the final Major Harmonic before the ultimate capitulation zone below at the 0/8th Major Harmonic at 3.00. Litecoin experienced a debilitating move below this 1/8th Major Harmonic back in October of 2018 but was halted at the 50% level between the 1/8th and 0/8th levels at 30.38. While there were some pushes below that level, it remained as the lowest major support level for Litecoin during the most recent cryptocurrency bear market. But since January of 2019, Litecoin has experienced a significant and powerful drive higher. The first test of the 1/8th Major Harmonic happened on March 6th, 2019 and then again on March 8th, 2019. Litecoin experienced a -12% drop from the 9th to 12th. Ever since that time, prices have moved higher. March 15th saw Litecoin finally breach the 1/8th Major Harmonic and has not returned to it as of yet. When price moves above this kind of a level and remains above it, it becomes the newest and strongest support level for a very, very long time. This move is the single most powerful and important price action that has occurred for any of the top 10 market cap cryptocurrencies. It is doubly important because Litecoin is a kind of barometer for the entire altcoin sector. I think of Litecoin as I would the NASDAQ and Bitcoin would be the Dow Jones.
Will Litecoin keep rising? Predicted price range and important dates
Predicting any future move from this current level can be simplified by looking at the foldback pattern from the prior trend. If price action is to follow the prior price action in the foldback pattern, then anymore future price rises will be limited for at least the next 24 days (April 7th, 2019). On that date, there is a 4/8th time-harmonic, which is the 50% level in time within the Law of Vibration. The geometry on the chart creates a fairly wide distribution range – so we can also predict the trading range over the next 24 days. I can predict and expect some fairly volatile and big whipsaw moves, with the highest highs being found around 65.21 on or around March 24th and the lowest lows being found at 50.56 also on or around March 24th.