January 2019 Outlook For Stellar Lumens
The Stellar Lumens Bitcoin trading pair (XLM/BTC) had itself, up until Jan. 7, in a falling wedge pattern, setting the template for a quick bounce to the upside. The question is what happens after this bounce in ratio and the outlook for the rest of January.
Fundamental Outlook
The XLM token was recently listed on the Hong-Kong based Coinsuper exchange. This on the heels of the announcement of support from AlphaPoint for XLM tokens. So far, there's low trading volume on the XLM pairs available in both places, but the unlock of possibility in Asian trading is strong. Already, Stellar has a size-able portion of its daily trading volume directly with the Korean Won. Unlocking the Hong Kong market, or the Chinese one in the future, could be a big win for the altcoin ranked 6th currently in total market cap.
Stellar Lumens has some very good partnerships, including IBM, that will hopefully come to fruition in terms of network usage in 2019. The coin's opportunity is in disrupting institutions like banking, a clear focus for Stellar CEO Jed McCaleb. It aims to do this through low-cost transfers and the incredible speed at which Stellar has tested-with transactions happening as quickly as three seconds, a record by some standards.
Technical Outlook
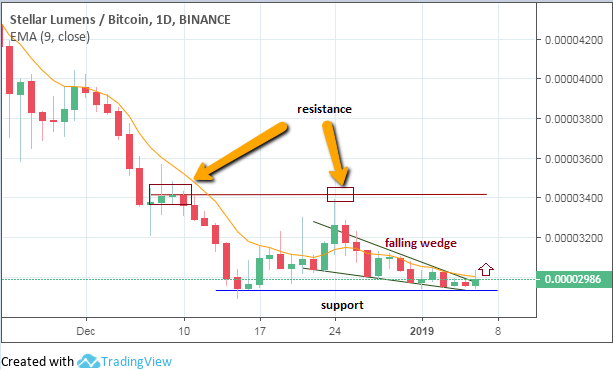
We start our analysis on the XLM/BTC pairing by taking a technical look at the daily chart. We can see that the price action in the past peaked at the 0.00003400 mark at two points, providing a basis for setting a resistance line at that level. In addition, we also see that prices dipped to a low of 0.00002933 mark, which sets up this area to be a long-term resistance.
XLM/BTC Daily Chart: Jan. 6, 2018
In between these key areas of support and resistance lies a price pattern formation: the falling wedge. This pattern has been in evolution for three weeks and looks to be at the point of upside break.
To get a clearer picture of this pattern, we look towards the 4-hour chart, where we can see that the falling wedge is indeed in evolution and that price looks set to pull off an upside break.
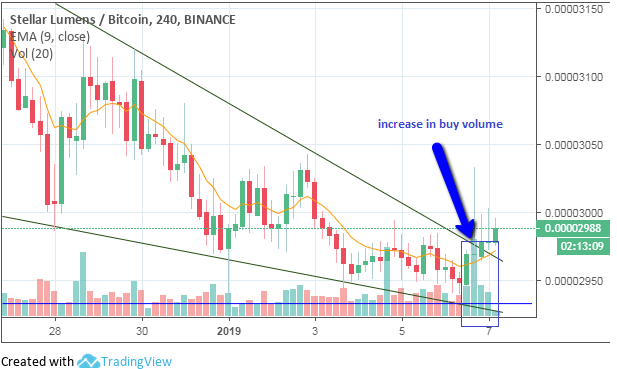
XLM/BTC 4-hour Chart: Jan. 6, 2018
Now that we have an idea of what is going on with the pairing of Stellar Lumens and Bitcoin, what are the possible trade scenarios for traders wishing to trade the XLM/USD crypto pair?
Trade Scenario 1
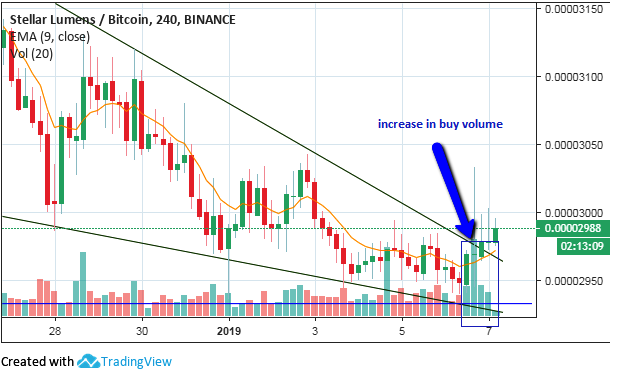
The outcome of a falling wedge pattern is for a bullish breakout to occur. However, this move must be accompanied by an increase in the buying volume. A critical look at the expanded 4-hour chart will show that this condition has been met.
Furthermore, a generalized bullish sentiment developed in the cryptocurrency market over the weekend. We also see the 9-day moving average providing dynamic support to price action. Therefore, the expected scenario is for a bullish breakout of the falling wedge pattern to occur. Following the upward break, we expect the 0.00003400 price level to function as the initial resistance to this price move. Along the way, price will have to encounter the following minor resistance levels:
-
- 0.00002988 BTC
- 0.00003030 BTC
These price levels are displayed below:
Jan. 7 Breakout
Stellar Lumens had a breakout run on Monday, Jan. 7. Since the expected bullish run has occurred, the question has to shift as to what happens to further price action. This is an opportunity to describe what happens if a trader misses an initial run.
It must be stated that there were minor resistance levels along the bullish path. One presently exists at the 0.00002988 price area, and another exists at the 0.00003030 price level. The 0.00003400 level is a major resistance which is where price action stalled for the day.
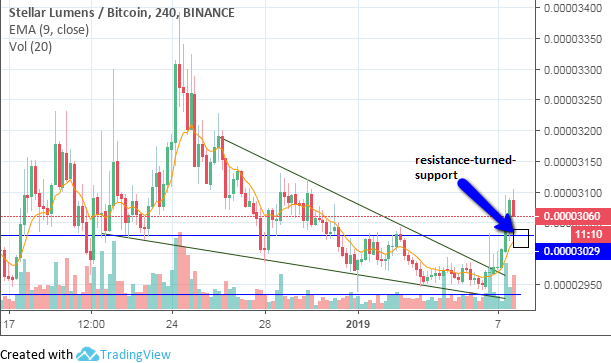
We expect price action to retreat to the minor resistance level of 0.00003030. If this price level is able to hold, expect a bounce of price action, which will produce another bullish leg upwards. However, if this price level fails to hold, then price will dip further to the next minor resistance level at 0.00002988.
It is therefore important to consider the closing prices of the candles/bars that will interact with these price areas, as this is how to determine whether prices will bounce off these levels or just plough right through them.
Market Sentiment
The long-term, mid-term and short-term outlook of the XLM/BTC pair is:
-
- Long Term - neutral to bullish
- Mid-term - bullish
- Short term - bullish
Please note: These analyses were sequentially done on daily and 4-hour charts, so price moves are expected to complete within the course of the next two weeks.
Posted from Cryptotreat Cryptotreat : https://cryptotreat.com/january-2019-outlook-for-stellar-lumens/