Finding Value After the Latest Altcoin Sell Off
After another big move in crypto currencies over the last few days, correcting lower from their highs of just over a week ago, which tokens are left looking undervalued using linear regression?
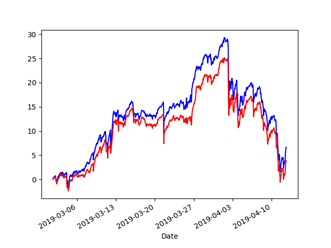
This chart is something I find myself paying more and more attention to. It’s a chart of the cumulative returns of the average hourly move of every coin, in Bitcoin terms, in this instance, on Binance. The red line is the average of every coin, while the blue line drops the top and bottom 5 performing coins for every hour. Although technically it’s not an index, I like to think of it as such, and measure my own trading against it, as well as use it as a guide to the market’s general strength or weakness.
As you can see since the start of March the average Altcoin rallied 30% before correcting sharply in the last week. A big move like this often leads to mispricing, especially in markets as new and immature as cryptocurrencies, so I thought it would be interesting to use some multiple linear regression to find which coins looked cheapest after this week’s move.
Using Sci-Kit Learn’s LinearRegression and Panda’s Correlation Matrix functions I modeled each currency pair’s cumulative returns since the start of March, using its 3 highest correlated currency pairs as the independent variables. I then simply calculated the difference between the coins returns since the beginning of March with what was modeled.
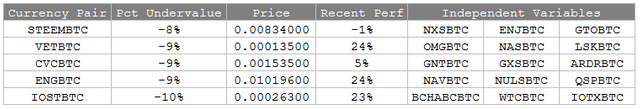
Here we can see the cheapest 5 currency pairs, with how undervalued they are and their performance going back to the start of March. It’s interesting to note that three of the most undervalued coins are still up close to 20% since the start of March, this is due to the strong performance of their independent variables, suggesting that perhaps it’s these independent variables that are overvalued, and not the currency pair itself being undervalued.
So, the question is what does one do with this information? Well for this to be a true statistical arbitrage trade, you would have to Buy the undervalued currency pair, e.g. CVCBTC and sell the 3 other independent variables, e.g. GNTBTC, GXSBTC and ARDRBTC. This is because either CVCBTC is undervalued, or the other independent variables are overvalued, and by putting on that spread you are hoping for one or all of them to come back in to line.
Given that shorting coins isn’t really an option open to most, the way I like to look at it is what has the market done in general recently and which side of this would I rather take. Given the market as a whole has sold off in the last week, I’m more inclined to want to buy the undervalued coin, and not worry about selling the others, and vice versa, had we had a big rally I probably wouldn’t want to be buying the undervalued coin, I’d want to be selling the other independent variables, so I would probably sit it out as shorting coins isn’t really an option.
So, with all this in mind I would look to STEEMBTC or CVCBTC here as the ones representing the best value to go outright long with, despite technically not being the cheapest, however this is of course just an exercise in looking at interesting statistical arbitrage opportunities and isn’t a trade recommendation. GL.
Awesome post cryptomarketstat great stats for the altmarket welcome to the Steemit Community we encourage sharing so feel free to share as you like cryptomarketstat and thanks for taking time out of your busy schedule just to join us and sharing this great post we appreciate that cryptomarketstat feel free to explore post and enjoy your new Steemit account cryptomarketstat thanks for sharing and joining us enjoy